


Charts make your reports, dashboards look more presentable. We have written series of blogs on charting methods throughout this site. In one of my blogs I had explained how we can create chart blocks and display them on Interactive Dashboards. Below is the link.
Related Post: View GUMU Dashboard in Sage CRM using GUMU Integration for Sage 100 ERP
As you know Interactive dashboards were added only version 7.0 onwards. How about the people who are using old versions and have not upgraded yet? Yes, they can also have similar functionality on Classic Dashboards too.
Process remains more or less same.
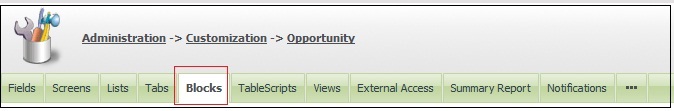
First you have to go to blocks section from Administration | Customization | Opportunity | Blocks.
To create new Chart block;
1. Click on New button
2. Enter the below given details
Block Name: Chart: Opportunities by Territory
Block Type: Chart Block
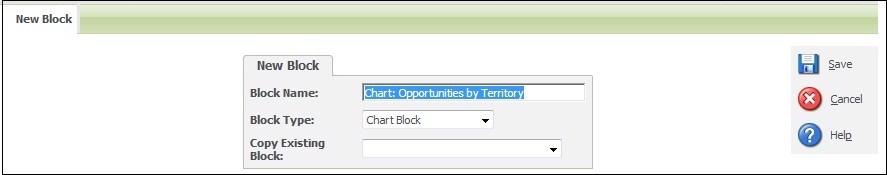
3. Click on Save button
4. Click on Chart: Opportunities by Territory hyperlink from list
5. Enter Below given Details
Title: Opportunities by Territory
Classic Dashboard Level: Available In Dashboard
Description: Opportunities by Territory
SQL Text: < Enter Required SQL Condition if any>
Save as Gifs: Yes
Label X Axis: < Enter Required Label for x axis of your chart>
Label Y Axis: < Enter Required Label for Y axis of your chart >
Different Colors: Yes
Bar Width Perc: 80
Remove Legend: Yes
Chart Type: HBar
X Label Property: < Enter Required Field Name. We are adding territory field here as we are charting count by territory>
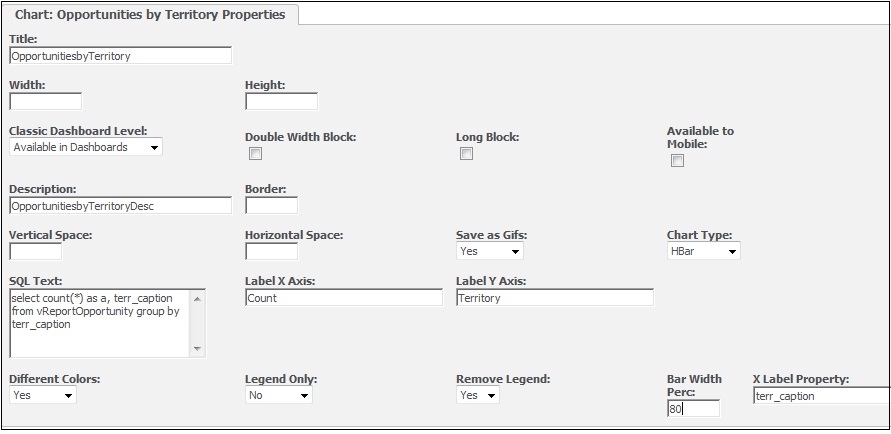
6. Click on Save button
Using above process you can create Chart block under required entity. Now you can display this block on Classic Dashboard.
1. Go To My CRM | Dashboard
2. Click on Classic Dashboard
3. Click on New Dashboard button
4. Enter the Dashboard Name
5. Click on Continue button
6. Select Opportunity from Category selection list
7. Select Chart: Opportunities by Territory from list
8. Click on Add button
9. Click on Save button
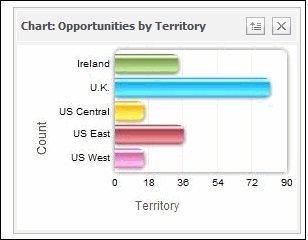
Here is how the chart will look like on your dashboard.
Also Read:
1) Progressing workflows through Interactive Dashboard
2) XML based Fusion charts in COM API
3) Sales Funnel on Dashboard Sage CRM 7.2
4) Charts On Interactive Dashboard
5) Generating a Simple Pie chart in Sage CRM using COM API