In our earlier post, we had explained how to display Fusion charts using COM API and .NET API and add drill-down to the Fusion charts. In this blog post, we will be explaining how to add fusion charts to Sage CRM Interactive Dashboards.
New Stuff: Profile Pictures for users on Sage CRM Dot Com
Consider an example where you want to display a Fusion chart on Leads assigned to the Users, as per their stage, and add that chart into an Interactive Dashboards. Follow below steps to achieve it.
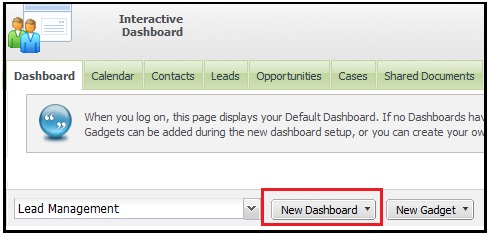
1) Create a new Dashboard using New Dashboard button.
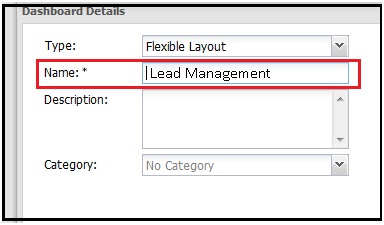
2) Enter Name of the Dashboard and click on OK button.
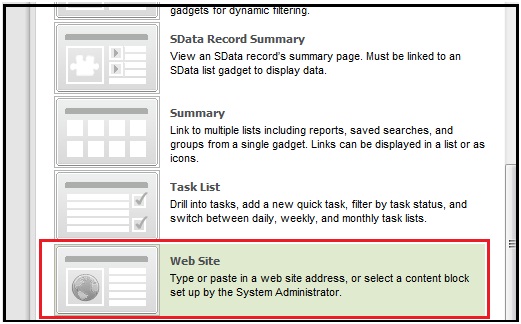
3) Then click on New Gadget button and select Web Site Gadgets from the list as shown below.
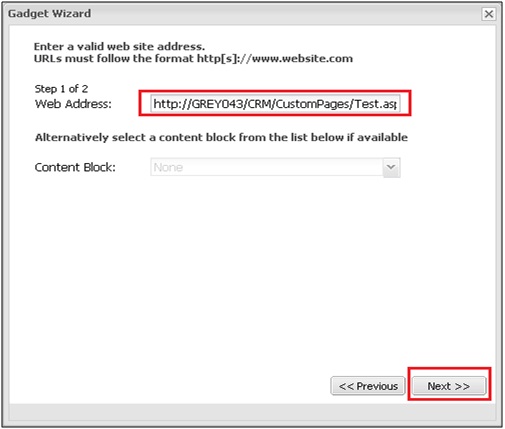
4) You will be navigated to below screen. Enter Web Address as shown below.
http://GREY043/CRM/CustomPages/Test.asp
Here
GREY043 = Server Name
CRM = Sage CRM Instance Name
Kindly note that you need to design ASP page so that it will display Fusion Chart as requested. You can refer our blog post on this for assistance. Here is the link.
XML based Fusion Charts using .NET API
XML based Fusion charts in COM API
5) Click on Next button and enter name of the Gadget as shown below.
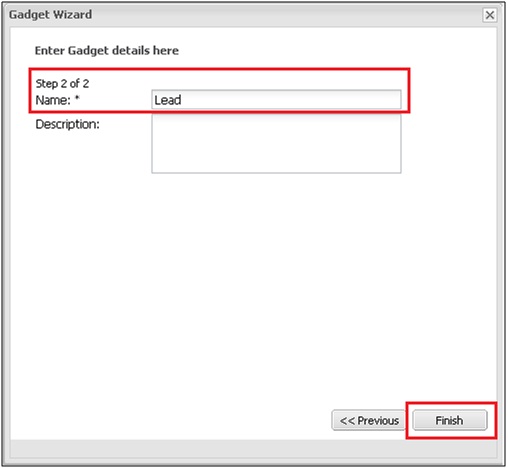
6) Finally, click on Finish button and you will get the Fusion charts displayed within Sage CRM Dashboard as shown below.
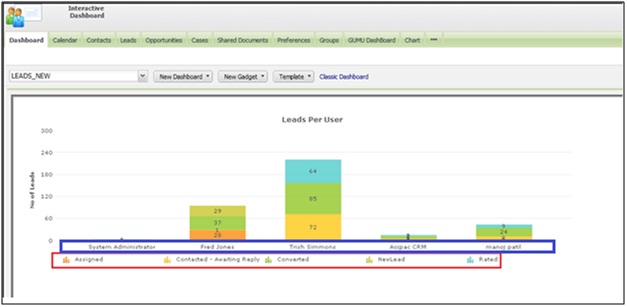
You can further customize fusion charts to add drill-down links. Refer our blog post on the same.
https://www.greytrix.com/blogs/sagecrm/2014/05/16/adding-drill-down-links-to-fusion-charts/
This way, you can add any fusion charts to Sage CRM Dashboard for any Primary, Secondary or Custom entity.
Also Read:
1) Adding drill-down links to Fusion Charts
2) XML based Fusion Charts using .NET API
3) Show Chart Block On Classic Dashboard
4) Generating a Simple Pie chart in Sage CRM using COM API
5) Re-Organization Charts
Sage CRM – Tips, Tricks and Components
Greytrix is one of the oldest Sage Development Partner of two decades for Sage CRM and has been awarded "Sage Development Partner of the Year" three times in the past years. Greytrix has been working on customization and configuration of products in Sage CRM since decades and have accumulated hundreds of man years of experience. In these blogs, Greytrix will endeavour to share its knowledge and expertise and save upto 90% of project cost for Sage CRM users by presenting a list of useful small components, tools and add-ons for Sage CRM! Contact us at sage@greytrix.com
Greytrix is one of the oldest Sage Development Partner of two decades for Sage CRM and has been awarded "Sage Development Partner of the Year" three times in the past years. Greytrix has been working on customization and configuration of products in Sage CRM since decades and have accumulated hundreds of man years of experience. In these blogs, Greytrix will endeavour to share its knowledge and expertise and save upto 90% of project cost for Sage CRM users by presenting a list of useful small components, tools and add-ons for Sage CRM! Contact us at sage@greytrix.com


Iconic One Theme | Powered by Wordpress