SageCRM has a functionality of a dashboard which provides the user a summarized view of all the data like the opportunity forecast, case that were closed, cases that are open etc. The customization functionality of the dashboard adds further leverage to the functionality to get graphs and grid for the users. This allows the user to see all that statistics for the data that exists in SageCRM. But what about showing the data that does not exist in SageCRM!!!!!
As most of us will agree that the best way and the quickest way to get the information across to the user are through pictures. The ancient humans certainly believed in this as the pictures and images in caves and on rocks is a testimony to this fact. No I am not going to tell you ways of carving the information on rocks and hand it over to your customer every month. I am just trying to say that a graphical dashboard normally gets the message across more quickly than any other format. Having said that, one can only judge a performance if one is able to compare the actual results with an expected result or in other words, targets.
Wouldn’t it be great if you are a sales manager and you login to SageCRM and open the dashboard and in one quick glance you would know if you can face your boss with you head held high or hope you become invisible. Other than that if you need to analyze your or your team’s performance, study patterns and accordingly plan for future and as they say at IBM, build a smarter planet.
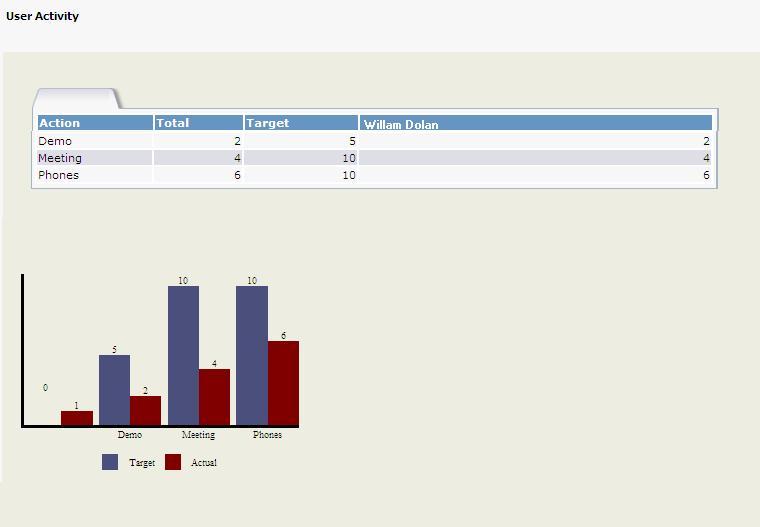
Hence, starting with a small step in that direction, we have made it possible to display multiple bar graphs in SageCRM as the standard graph objects in SageCRM allow just single bar graphs. The feature that we have developed allows the user to set targets to each of the communication and opportunity types for each user and then use this information to beautifully present this on the user dashboard.
Here is how it will look on dashboard.
If you find this content useful, Please drop us an email at crm@greytrix.com.