Inventory Turnover Ratio in Acumatica
For retailers, distributors, and manufacturers, inventory management is key to operational success. Your inventory is your most important asset, and, to meet customer demand, in Acumatica you can manage Inventory turnover in easy steps Also from shifting customer demand to cross-border logistics, can make it challenging to manage but in Acumatica it has never been challenging.
How to Calculate Your Inventory Turnover Ratio: Calculating your Inventory Turnover Ratio requires several steps. Here is the main formula:
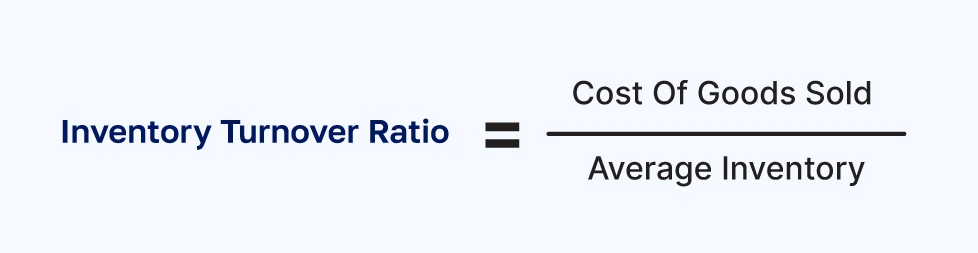
COGS / Average Value of Inventory = Inventory Turnover Ratio
COGS, which stands for Cost incurred to sell Goods, Average Value of Inventory is the monetary value of your inventory during the specific timeframe you’ve chosen to measure (e.g., month, quarter, or year). And you calculate it as you would the mean or average of any two numbers: by adding the Beginning Inventory Value to the Ending Inventory Value and dividing the sum by 2.
(Beginning Inventory Value + Ending Inventory Value) / 2 = Average Value of Inventory
Beginning Inventory Value must be the same as the Ending Inventory Value for the previous period, most important is to know how to calculate it separately, so you should double-check its accuracy. You can calculate Beginning Inventory Value with this formula:
COGS + Previous Period Ending Inventory Value – Previous Period Value of New Inventory Bought = Beginning Inventory Value
Once the Beginning Inventory Value confirmed, It should be use it to calculate the Ending Inventory Value like this:
Current Period Beginning Inventory + Current Period Net Purchases – COGS = Ending Inventory Value:
Net Purchases variable represents the gross monetary value of new inventory purchased during the chosen period, minus discounts, returns, and allowances’, let’s put all these steps together to calculate an Inventory Turnover Ratio.
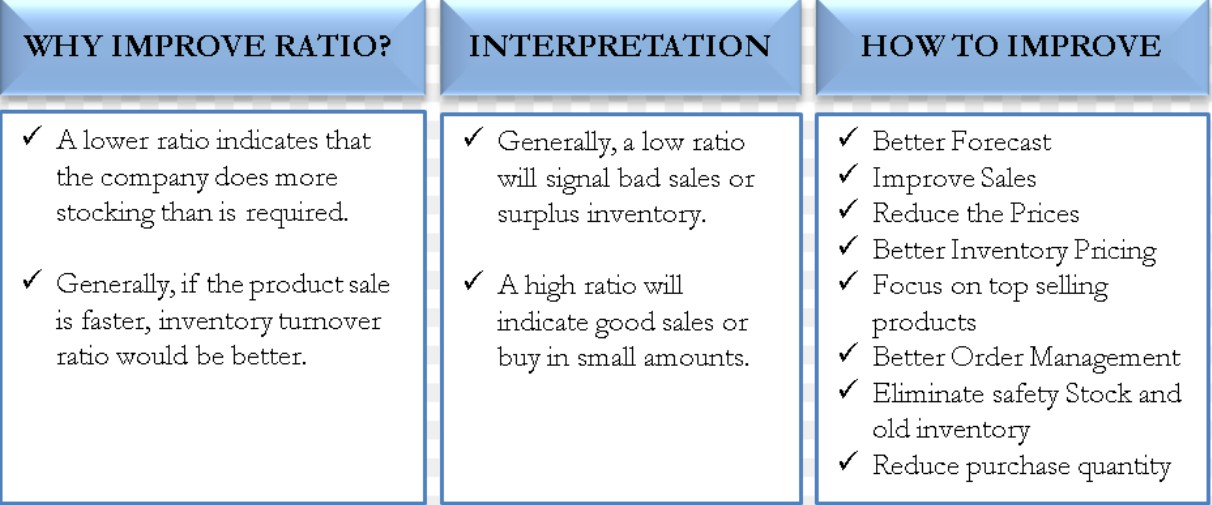
What Is a Good Inventory Turnover Ratio
- It varies significantly across industries, business models, and market conditions. The average inventory turnover ratio should be between 5 and 10 for most companies. Good stock turnover ratio depends on several factors
- Industry Standards: Different industries have varying inventory turnover benchmarks. For instance, industries dealing with perishable goods like food may have higher turnover ratios compared to industries with durable goods like machinery.
- Business Strategy: Companies with a focus on fast-moving, high-volume sales may naturally have higher turnover ratios. On the other hand, luxury or specialty goods retailers might have lower turnover ratios due to lower sales volume but higher margins.
- Market Conditions: Economic fluctuations, seasonal demands, and market trends can impact inventory turnover. A good ratio in one year might not be ideal in another due to external factors affecting consumer behaviour.
- Company Goals and Practices: Some businesses might intentionally maintain a lower turnover ratio to ensure a broader range of product availability or to negotiate better purchase terms with suppliers.
Inventory Turnover Ratio Example: Let’s say you want to calculate your Inventory Turnover Ratio for April 2025. You’ll complete the formulas above in this order:
- Beginning Inventory Value: COGS + Ending Inventory Value from Previous Period – Value of New Inventory Bought During Previous Period = Beginning Inventory Value
- Ending Inventory Value: Beginning Inventory of Current Period + Net Purchases During Current Period – COGS = Ending Inventory Value
- Average Value of Inventory: (Beginning Inventory Value + Ending Inventory Value) / 2 = Average Value of Inventory
- Inventory Turnover Ratio: COGS / Average Value of Inventory = Inventory Turnover Ratio Let’s say that your COGS for March 2025 was $50,000, your Ending Inventory Value was $40,000, and the value of your New Inventory Bought was $40,000. That means your Beginning Inventory Value is $50,000 (the same as the Ending Inventory Value for March.)
$50,000 + $40,000 – $40,000 = $50,000 If your Beginning Inventory Value was $50,000, your Net Purchases for April were $75,000, and your COGS was $80,000, then your Ending Inventory Value for April was $45,000.
$50,000 + $75,000 – $80,000 = $45,000 Using the Beginning and Ending Inventory Values, your Average Value of Inventory was $47,500.
($50,000 + $45,000) / 2 = $47,500 And, using your April COGS and Average Value of Inventory numbers, your Inventory Turnover Ratio is 1.7.
$80,000 / $47,500 = 1.7 This means, for April 2025, you completed almost two full inventory turnover cycles. And again, whether that ratio is good or not depends entirely on your industry and on the specific conditions in which your business operates.
Improving and Automating Inventory Turnover: You need to regularly monitor and optimize your inventory processes on every level to continually improve operational efficiency and financial health.
But with the help of technology designed for the task, such as an Enterprise Resource Planning (ERP) solution Relying on connected, modern technology for tracking, monitoring, and analysing inventory turnover helps improve efficiency, increase cash flow, and, ultimately, boost profitability.
Inventory Management Success with Acumatica: Acumatica Cloud ERP and its Inventory Management solution empower users to control inventory across locations, automate orders, streamline workflows, and track items (and costs) from a single, centralized solution. The benefits? Increased inventory turns, improved accuracy, and reduced stock-out situations; insights into low and dead stock items; and the ability to analyse profitability by item and product class or family. Acumatica has made a world of difference in the company’s ability to forecast demand, manage inventory turnover, and know what products they need to stock or phase out.
Best Inventory Turnover Optimization Techniques
1. Simplify the supply chain
Streamlining the supply chain and Simplification which involves optimizing supplier relationships, reducing the number of suppliers when possible, and improving communication and coordination with suppliers can significantly impact inventory turnover. This can lead to faster delivery times, better inventory control, and reduced lead times, allowing for a more responsive and efficient supply chain.
2. Adjust pricing strategy
By adjusting prices based on demand, seasonality, or market trends, businesses can stimulate sales and move inventory more quickly examples of which are discounts, promotions, or bundling strategies which encourages customers to buy more, reducing excess inventory and improving turnover rates.
3. Check or change your industry ranking
Understanding market demand, trends, and consumer behaviour helps in aligning inventory levels with what customers want thereby focusing on products with higher demand or differentiating your offerings to stand out within the market can positively impact turnover.
4. Enhance forecasting
Enhanced forecasting helps in aligning inventory levels with expected demand, reducing the risk of overstocking or stockouts and ensuring optimal inventory turnover i.e. historical sales data, market trends, seasonality, and customer insights which improves forecasting accuracy.
5. Automate purchase orders
Implementing automation i.e. automatic purchase order generation based on inventory levels or sales forecasts, will lead to improve inventory turnover which in turn reduces manual errors, ensures timely replenishment of stock, and optimizes inventory levels, leading to improved turnover rates.
Conclusion:
Employing these inventory techniques collectively or individually can drive operational efficiency, boost cash flow, reduce carrying costs, and enhance customer satisfaction by ensuring product availability.
Want to lean more about Inventory Management Ratio visit our website: Greytrix | Expert ERP and CRM Consultants