Lots of time we have seen that almost all of the web versions of any applications has “Dashboards”. The dashboard is nothing but the graphical representation of your business performance shown in a single screen. Dashboards are easy to understand & easily accessible by the user from a single screen. Dashboards have color-coded bar charts & graphs that give users a fast look at their functional area.
If you have a desktop version of Sage 300 & you are looking for dashboards then here is the solution for you. We have come up with Dashboard which will show you an overview of OE module transactions like Order, Shipment & Invoice. Below is the detail description of this dashboard.
OE Module dashboard can be easily added to your Sage Desktop & access from there itself. This will have date filter & depend on your date selection, the dashboard will show you an overview of OE Module data in Bar Chart form. (Refer below screenshot)
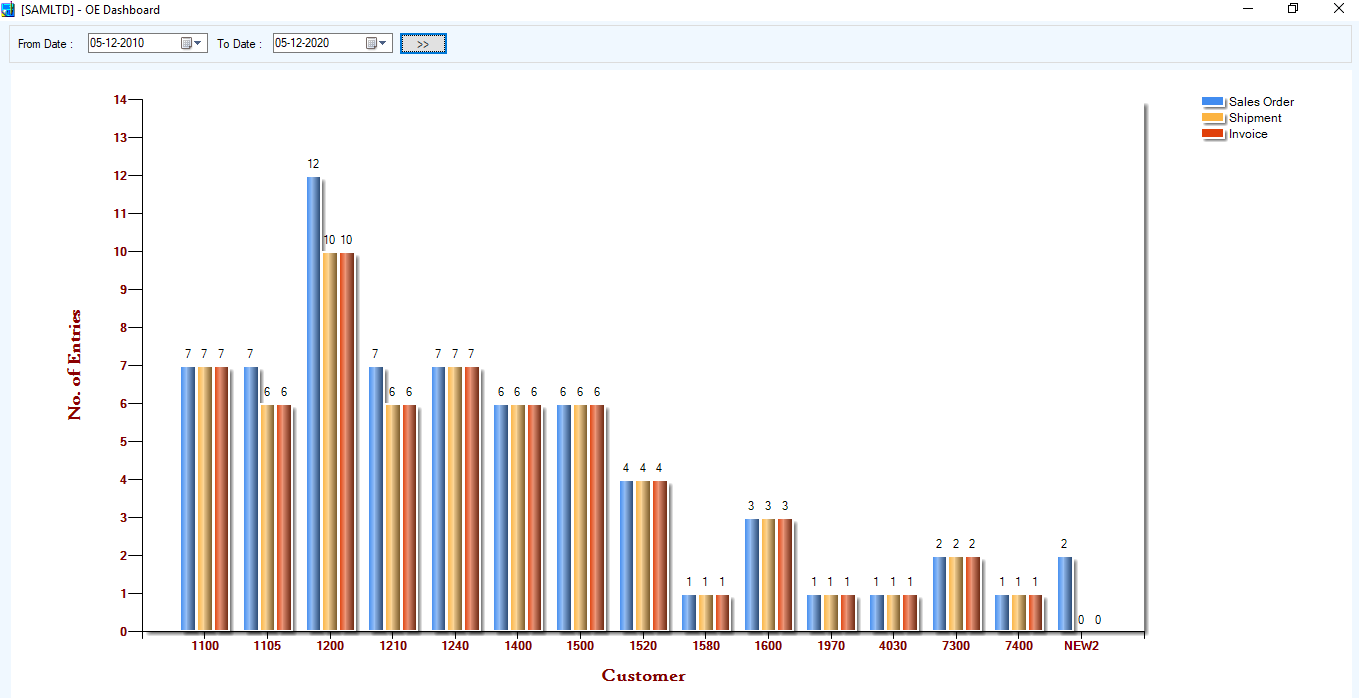
If you look at carefully, you can see that this shows you customer wise total number of entries of Order, Shipment & Invoice. On the top side of bar total count of respective entry & at the bottom customer, code is there.
Sage 300 ERP – Tips, Tricks and Components
Explore the world of Sage 300 with our insightful blogs, expert tips, and the latest updates. We’ll empower you to leverage Sage 300 to its fullest potential. As your one-stop partner, Greytrix delivers exceptional solutions and integrations for Sage 300. Our blogs extend our support to businesses, covering the latest insights and trends. Dive in and transform your Sage 300 experience with us!