Fusion charts component added to SageCRM improves the overall visual experience of reports. We can display fusion charts on dashboards too. There are already methods explained in Developer guide to build the charts using API methods. In this blog I will explain how we can use fusion widget xml to build the chart and display it using COM API ASP.
You can get xml syntax for all fusion chart widgets here.
Related Post : View Real-time Sage 100 data charts on GUMU Dashboard in Sage CRM
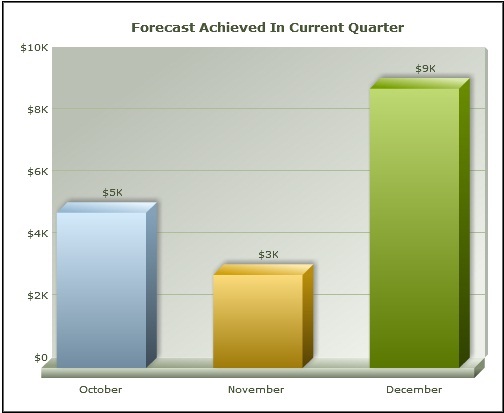
Let’s consider that we want to display the bar chart for forecast achieved in current quarter. Now let us create our xml data source in one file named data.xml as follows. This is just the hardcoded xml which we are picking up from file. If you want you can write logic in your ASP page to generate this xml and pass it to charting logic.
<chart showBorder=”1″ imageSave=”1″ numberPrefix=”$” caption=”Forecast Achieved in Current Quarter”>
<set label=”October” value=”5000″ />
<set label=”November” value=”3000″ />
<set label=”December” value=”9000″ />
</chart>
Before moving forward please ensure that FusionCharts.asp, FusionCharts.js and the above Data.xml files are placed inside the FusionCharts folder under WWWRoot.
Follow the below steps to call the Data.xml file using COM API ASP.
1. Create one ASP page (For e.g. Fusion.asp) and include “FusionCharts.asp” page in the same using following syntax.
<!– #INCLUDE FILE=”..\FusionCharts\FusionCharts.asp”–>
2. Include “FusionCharts.js” file using following syntax.
<HTML>
<HEAD>
<SCRIPT LANGUAGE=”Javascript” SRC=”../FusionCharts/FusionCharts.js”></SCRIPT>
</HEAD>
<BODY>
Call below function to render fusion chart.
3. Call renderChart(“../FusionCharts/Column3D.swf”, “../FusionCharts/Chart.xml”, “”, “myFirst”,”100%”, “100%”, false, false)
4.Create another asp page through which we will call our above Fusion.asp page to display Fusion chart in iframe. Please refer following syntax.
//’Get block
blkContent = eWare.GetBlock(“Content”);
var ChartURL = eWare.URL(“Fusion.asp”);
blkContent.Contents = “<iframe src='”+ChartURL+”‘ id=framechart name=framechart width=800 height=600 frameBorder=0></iframe>”
//’Add block to container
with (ocontainer)
{
AddBlock(blkContent);
}
//’Execute container
eWare.AddContent(ocontainer.Execute());
By following above steps fusion chart will looks like as follows.