In my previous blog I had explained how we can generate XML based fusion charts in COM API. You can refer below link for the same.
Related Post: XML based Fusion charts in COM API
In this blog I will explain how you can follow similar methodology to generate fusion chart using .NET API. Let’s consider the same example which we considered in above blog that we want to display the bar chart for forecast achieved in current quarter. Now to do this we have to generate our data source in XML format. We can generate XML based data source in our .NET API code or else we can hardcode the XML in one file and will place it inside the FusionCharts folder under WWWRoot.
Greytrix and Sage ERP / CRM
The perfect combination for clients across various industries in India
Follow the below steps to generate the Fusion chart in .NET API.
1.Create basic template project of you CRM version in .NET.
2.Create one class namely “ColumnChart.cs”.
3.In ColumnChart.cs class, include following namespaces.
using System.Reflection;
using System.Xml;
using Sage.CRM.WebObject;
4.Then inherit the above class by Sage CRM’s web class as follows and add its abstract class
BuildContents as follows.
class ColumnChart:Web
{
public override void BuildContents()
{
}
}
5.Write method named “GenerateColumnXML” in above class to generate XML as follows:
private XmlDocument GenerateColumnXML()
{
XmlDocument docConfig = new XmlDocument();
XmlNode xmlNode = docConfig.CreateNode(XmlNodeType.XmlDeclaration, “”, “”);
XmlElement rootElement = docConfig.CreateElement(“chart”);
rootElement.SetAttribute(“showBorder”, “1”);
rootElement.SetAttribute(“imageSave”, “1”);
rootElement.SetAttribute(“numberPrefix”, “$”);
rootElement.SetAttribute(“caption”, “Forecast Achieved In Current Quarter”);
docConfig.AppendChild(rootElement);
try
{
XmlElement hedder = docConfig.CreateElement(“set”);
hedder.SetAttribute(“label”, “October”);
hedder.SetAttribute(“value”, “5000”);
docConfig.DocumentElement.PrependChild(hedder);
docConfig.ChildNodes.Item(0).AppendChild(hedder);
XmlElement hedder1 = docConfig.CreateElement(“set”);
hedder1.SetAttribute(“label”, “November”);
hedder1.SetAttribute(“value”, “3000”);
docConfig.DocumentElement.PrependChild(hedder1);
docConfig.ChildNodes.Item(0).AppendChild(hedder1);
XmlElement hedder2 = docConfig.CreateElement(“set”);
hedder2.SetAttribute(“label”, “December”);
hedder2.SetAttribute(“value”, “9000”);
docConfig.DocumentElement.PrependChild(hedder2);
docConfig.ChildNodes.Item(0).AppendChild(hedder2);
}
catch (Exception ex)
{
AddContent(“<br>Error In Column chart=” + ex.Message.ToString());
}
return docConfig;
}
6.Before moving forward please ensure that you have kept “FusionCharts.dll” in the CustomDotNet folder of your CRM instance and “Column3D.swf” file in FusionCharts folder under WWWRoot.
7.Write all the below code in BuildContents method .
8.Call above GenerateColumnXML method to generate XML and then we have to replace special characters If any using following syntax.
XmlDocument ColumnXML = new XmlDocument();
ColumnXML = GenerateColumnXML();
string GeneratedColumnXML = ColumnXML.InnerXml.ToString();
GeneratedColumnXML = GeneratedColumnXML.Replace(“‘”, “%26apos;”);
GeneratedColumnXML = GeneratedColumnXML.Replace(“&”, “%26”);
GeneratedColumnXML = GeneratedColumnXML.Replace(“\””, “‘”);
9.Then load the methods in FusionCharts.dll to generate Fusion chart using following syntax. Here we have to pass the CustomDotNet folder path where FusionCharts.dll resides.
var FusionChartDLL = Assembly.LoadFile(@”D:\Program Files\Sage\CRM\CRM \CustomDotNet\FusionCharts.dll”);
10.Write the below code to generate Fusion chart and display it in CRM.
String sColumnContent = “”;
Object oColumnReturn = “”;
foreach (Type type in FusionChartDLL.GetExportedTypes())
{
var c = Activator.CreateInstance(type);
oColumnReturn = type.InvokeMember(“RenderChartHTML”, BindingFlags.InvokeMethod, null, c, new object[] { “http://localhost/CRM /FusionCharts/Column3D.swf”, “”, GeneratedColumnXML, “ColumnChart”, “500”, “410”, false });
sColumnContent = (String)oColumnReturn;
}
AddContent(sColumnContent);
11.In Base class of your project, write method to call our ColumnChart.cs class to generate fusion chart as follows and build the solution and make sure that the DLL getting generated in maintained under CustomDotNet folder of the CRM Instance.
public static void RunMyCustomPage(ref Web AretVal)
{
AretVal = new ColumnChart ();
}
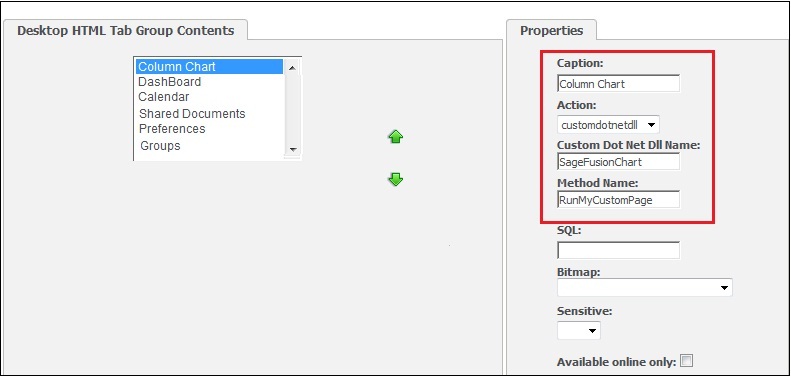
12.Go to the tab where you want to display chart and make the configuration as displayed in following screenshot. For now we are adding it in My CRM tab.
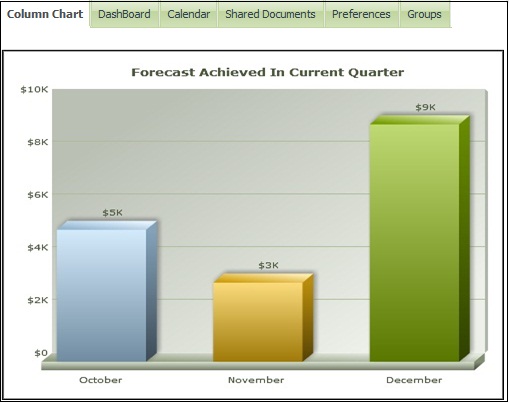
By following above steps fusion chart will looks like as follows.
Also Read:
1) Show Chart Block On Classic Dashboard
2) Progressing workflows through Interactive Dashboard
3) Generating a Simple Pie chart in Sage CRM using COM API
4) Sales Funnel on Dashboard Sage CRM 7.2
5) Charts On Interactive Dashboard