
Having accurate and accessible sales information is essential for making informed customer and sales decisions. However, when sales data is stored in Sage 300, users often need to switch between systems to review customer performance.
To simplify this process, we developed a Sage 300 Sales Analytics Data Panel for the Company Summary screen in Sage CRM.
The enhancement brings key sales metrics directly into Sage CRM, allowing users to quickly review current performance and historical sales trends from a single screen.
The Solution
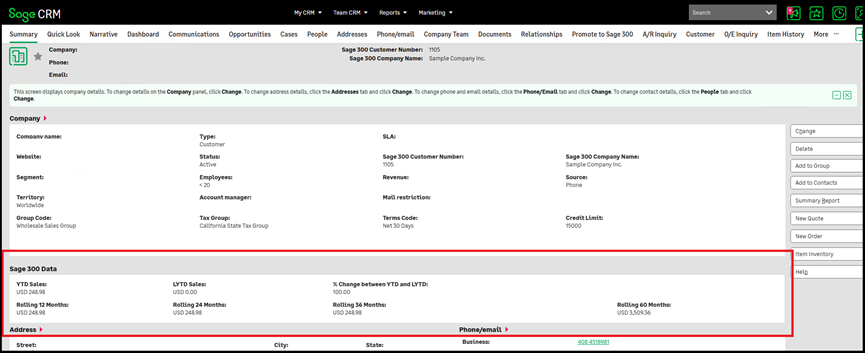
The new Sage 300 Data Panel provides a consolidated view of customer sales performance, including:
- Year-to-Date (YTD) Sales
- Last Year-to-Date (LYTD) Sales
- Percentage Change
- Rolling 12-Month Sales
- Rolling 24-Month Sales
- Rolling 36-Month Sales
- Rolling 60-Month Sales
By combining these metrics, users can quickly compare current performance with previous periods and identify short- and long-term purchasing trends.
Automated Data Synchronization
To keep the information updated, a Task Scheduler runs nightly to synchronize statistical data from Sage 300 into Sage CRM.
This automated process eliminates the need for users to manually update the sales statistics and ensures that the Data Panel is regularly refreshed with synchronized information.
Key Benefits
- Automated nightly synchronization.
- Reduced manual data maintenance.
- Regularly updated sales statistics.
- Consistent availability of sales information within Sage CRM.
Sage 300 Data Panel Visibility
The Data Panel is displayed only for companies that have been promoted to Sage 300.
For companies without a Sage 300 association, the panel remains hidden. This ensures that users see relevant sales information only when the required Sage 300 data is available.
Key Sales Metrics
Year-to-Date and Last Year-to-Date
YTD shows the customer’s sales for the current fiscal year, while LYTD provides the corresponding sales figure from the previous year.
Together, these metrics provide an easy year-over-year comparison.
Percentage Change
The Percentage Change metric highlights the difference between YTD and LYTD sales, allowing users to quickly determine whether customer sales have increased or decreased.
Rolling Sales Analysis
The Data Panel also provides rolling sales figures for 12, 24, 36, and 60 months.
These metrics provide different levels of historical context:
- 12 months – Recent purchasing trends.
- 24 months – Medium-term sales performance.
- 36 months – Three-year purchasing trends.
- 60 months – Long-term customer sales history.
This allows users to evaluate customer performance beyond a single fiscal year.
Business Benefits
The Sage 300 Sales Analytics Data Panel provides a number of practical benefits:
- Centralized Sales Visibility – View important Sage 300 sales information directly within Sage CRM.
- Faster Decision-Making – Access key metrics without switching between applications.
- Better Customer Insights – Understand current and historical purchasing behavior.
- Improved Sales Analysis – Compare performance across multiple time periods.
- Reduced Manual Effort – Automated synchronization keeps the data updated.
- Better Customer Discussions – Give sales teams the information they need during customer interactions.
The Sage 300 Sales Analytics Data Panel enhances the Sage CRM Company Summary screen by bringing important customer sales information into one convenient location.
With YTD, LYTD, Percentage Change, and rolling 12-, 24-, 36-, and 60-month sales metrics, users gain a clearer view of customer performance and purchasing trends.
Combined with nightly automated synchronization from Sage 300, this customization reduces application switching, minimizes manual effort, and helps sales teams make more informed, data-driven decisions directly within Sage CRM.