Sage CRM is an user friendly crm solution in which one can customize the way they want to extract data for analysis and reporting. In this blog post, we will explain how to use Sage CRM Graphic objects to show data in Graphical mode.
GUMU Sage CRM integration for Sage 100 ERP
Get real-time insights of your Sage 100 Sales/Customer/item data using the new GUMU Dashboard in Sage CRM
Consider an example where you want to show Forecast Data in Graphical form. You need to follow below steps for the same.
1) Login to Sage CRM and Navigate to below path.
Administration | Customization | Opportunity Progress
2) Select the Screens tab and click on the Opportunity Status Box.
3) Select Forecast (oppo_forecast) field and paste the below script in the Create Script section.
var strForecast=CRM.GetContextInfo(‘opportunity’,’oppo_forecast’);
var graphic;
graphic=CRM.GetBlock(‘graphic’);
graphic.DisplayForm = false;
graphic.Border=1;
graphic.ImageWidth=20;
graphic.ImageHeight=20;
graphic.Animation(‘Add’,’1′);
graphic.ImageWidth= strForecast/5;
graphic.ImageHeight=20;
graphic.GradientFill(‘Green’,’ Green ‘,’LeftToRight’);
graphic.TextOut(40, 1, strForecast, true);
graphic.Animation(‘Add’,’100′);
Caption = CRM.GetTrans (“colnames”, oppo_forecast”) +”:”+graphic.Execute();
CaptionPos = 2;
4) Click on Update button and finally click on Save button to save changes.
Now when you navigate to Opportunity Summary screen, you will observe that Forecast field is visible in a Graphic format as shown below.
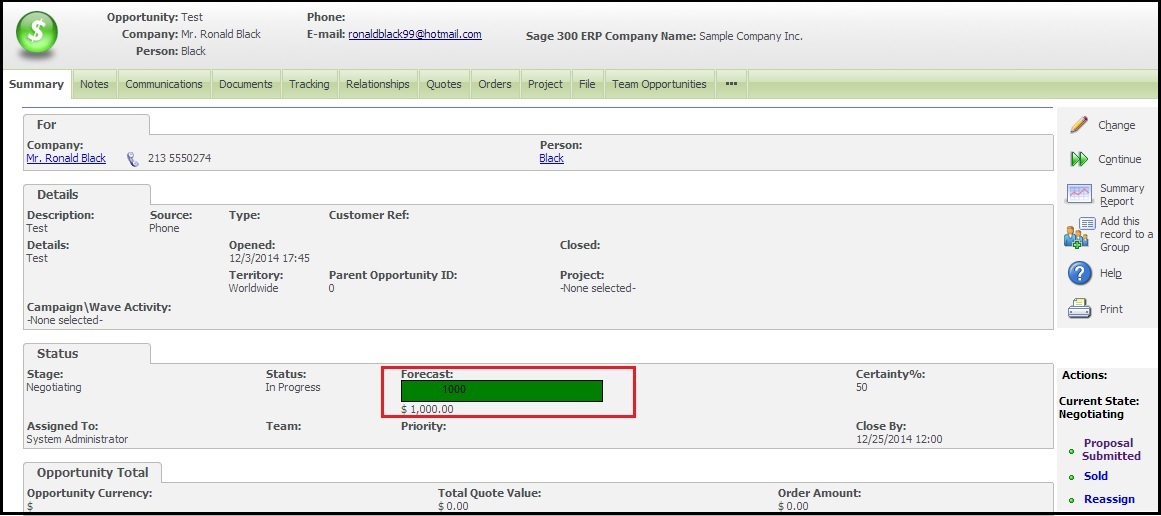
You can apply this trick to any other field with a few changes.
Also Read:
1) Generating a Simple Pie chart in Sage CRM using COM API
2) Increase number of width columns for Screen block
3) Information and Error Message feature in Sage CRM v7.2
4) Avoid scrolling with Collapse Screen Feature in Sage CRM7.2
5) Manage the size of the Recent List

Pingback: 먹튀검증
Pingback: ニコチンリキッド個人輸入
Pingback: click to find out more
Pingback: บาคาร่า ไพ่เสือมังกร
Pingback: pool companies in North Port Florida
Pingback: certified translation bangkok
Pingback: โคมไฟ
Pingback: Freshbet
Pingback: ชุดกระชับสัดส่วน
Pingback: เครื่องทําสเลอปี้
Pingback: เกมไพ่
Pingback: แทงหวย
Pingback: หนังใหม่พากย์ไทย
Pingback: bio ethanol wall fireplaces