In our last post Sales KPI dashboard in Sage CRM 7.3, we read about dashboards available in latest release of Sage CRM which are termed as Business Accelerators. Today, we will discuss one more type of dashboard which can be used by managers to get the better picture of the organization and current position of sales. This dashboard is called as Sales Metrics for Managers.
Download Greytrix Sage CRM v7.3 integrations for
Sage ERP X3 (Integrates v7/6.5 with CRM v7.3/7.2) | Sage 100 (MAS90) | Sage 500 (MAS500)
Well, this dashboard contains gadgets of different data which help us to measure progress towards your organization’s goals. See below screenshot for reference.
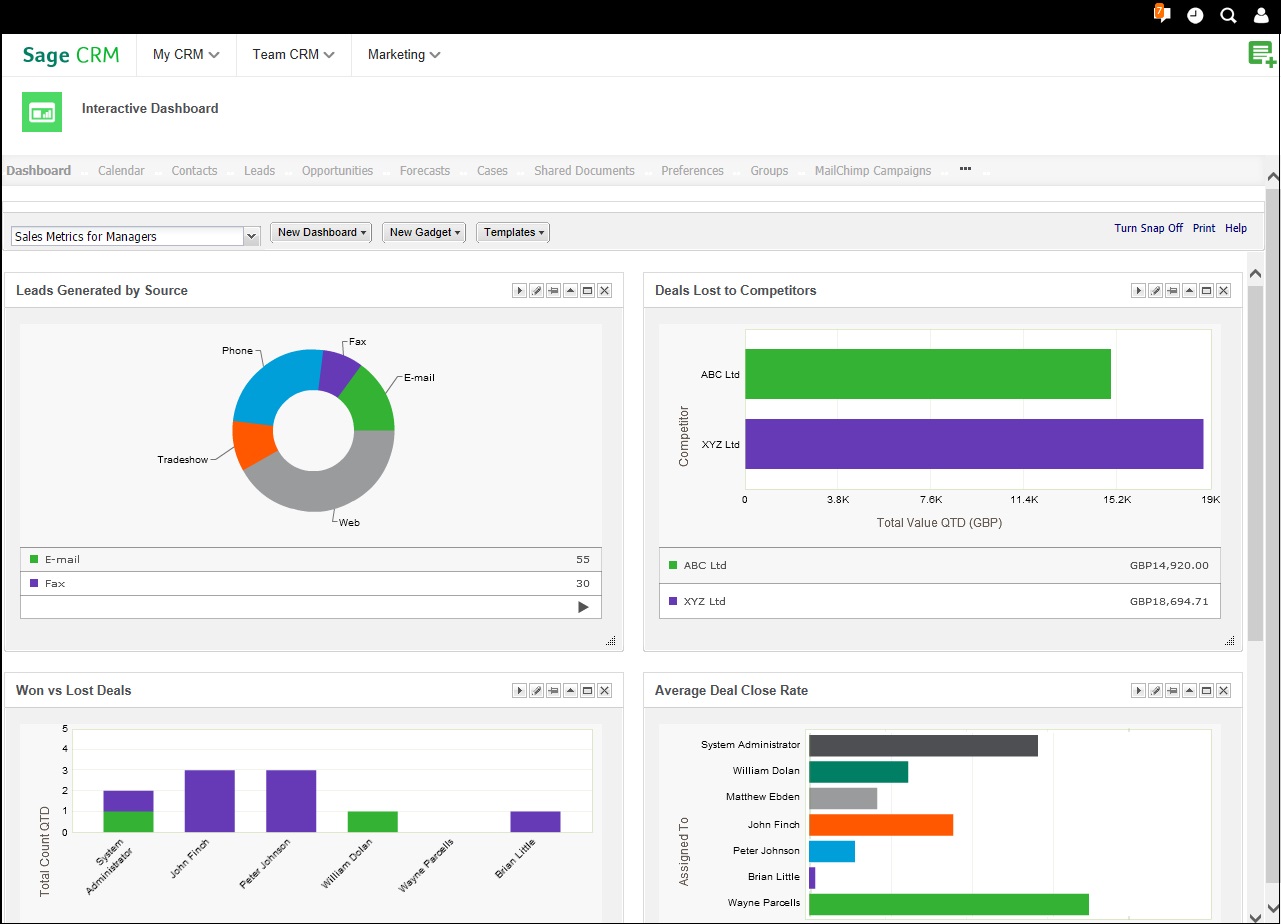
This dashboard has below gadgets by standard:
1. Deals Lost to Competitors: This is built though horizontal bars. Using this gadget you can see deals that your organization was bidding on but lost to a competitor. The report is based on the new Competitor, Winner, and Reason for Loss fields in each opportunity record.
2. Average Deal Close Rate: This is built through horizontal bars. Using this gadget you can see the amount of time between a new opportunity being created and closed. The information is grouped by sales rep.
3. Leads Generated by Source: This gadget shows how leads are available in system and how they were sourced accordingly.
4. Won vs Lost Deals: This gadget shows opportunities that each sales rep has Won and Lost in a specified period of time.
Also Read:
1. User specific data on Interactive dashboards
2. View Fusion Charts on Sage CRM Interactive Dashboards
3. 360° Customer View on Sage CRM Interactive Dashboards
4. Customer Dashboard with LinkedIn search
5. Sage 300 Order Details in Sage CRM Dashboard