Sage CRM has proved its efficiency and reliability in managing the Customer relationship with many prominent features. Not just with the data management but even the various outputs to fetch these data help in projecting the profits and analyzing the business revenue effortlessly. Sage CRM’s reporting feature has always been proved helpful to view the summary data. Report’s data extracted in rich graphic and interactive graphs has improved the look and feel as well as it has given better clarity to analyze data. The various chart styles within the Report output along with the list data proves helpful for Sales users as well as management to better understand the business achieved till date. These graphs or charts are managed by Fusion Charts in CRM.
FusionCharts functionality has been added to Sage CRM to improve the visual effect of graphs in Standard reports, on the Interactive dashboard, and when using Chart Blocks. Features of the charts include rotation, slicing movement, and printing. You can also customize Fusion Charts by changing the background color, or by adding shadow effects, background images, and logos to report charts. But when it comes to Standard Reports or Dashboards of CRM, the default look and feel of the graphs is not much attractive in Sage CRM.
New Stuff : Steps to implement Delete Order functionality in GUMU Sage CRM – Sage 100 Integration
As you can see in below screenshot, the image depicts the standard graph of Sage CRM report with zero responsiveness and eye catchy features.
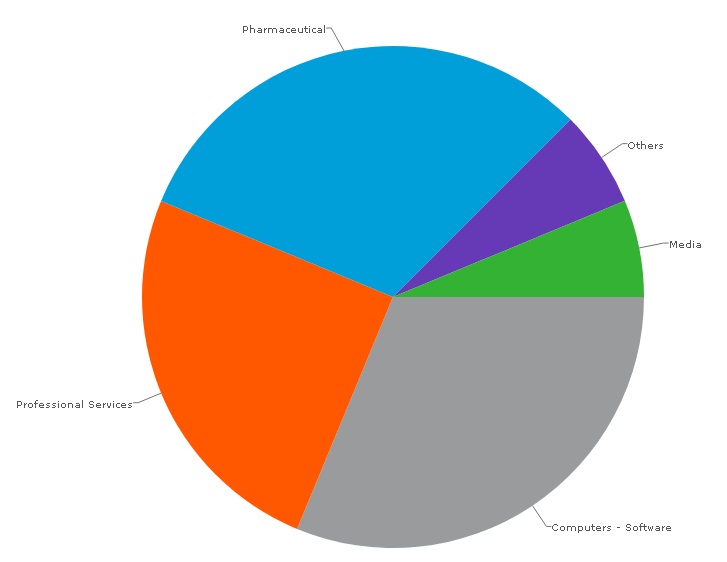
As you can refer in above screen shot, there is no any background effect nor any legends are visible in the graph not even values are displayed in percentage for each graph label.
Seeing this, one of our clients came up with the requirement where they required report graphs with attractive nature like changes in background color, displaying numeric or percentage values to Graph labels, showing legends on graph itself and rotate graph for pie chart related reports etc.
In this blog, we will explain how we customized the report graphs in Sage CRM with the help of Fusion Charts. To customize FusionCharts, you have to modify the .FSN file in the FusionChart folder of your Sage CRM install. Follow the below steps to make the changes in FusionCharts:
- Find the FusionChart folder in Drive/ ProgramFiles (x86)/ Sage /CRM/ InstallName /WWWRoot /Themes /FusionChart.
- Under FusionChart folder open the subfolder named Ergonomic
- Under Ergonomic folder open the Ergonomic.fsn file and make the changes as per the requirement and save the file.
- Once you save the file, refresh your CRM screen when you are finished making changes to see the results of your work.
Below are some examples for customizing report graphs:
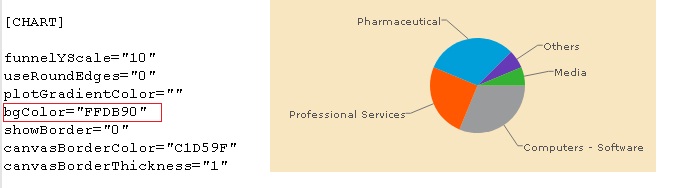
Change in Background Color:
Open the Ergonomic.fsn file with text editor software, such as Notepad, to view the content. Find the “bgColor” line and replace the existing value with any hex color code that you want, Save the file and refresh your CRM screen when you are finished making changes to see the results of your work. Refer below screen shot for your reference.
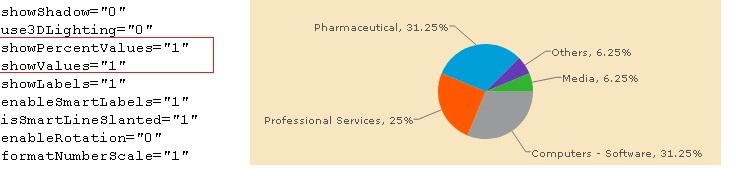
Add Percentage values to Graph Labels:
Open the Ergonomic.fsn file, find the showValues=”0” line, and change the value from “0” to “1”. Also find the line showPercentValues=”0” and change the value to “1”. Save the changes and refresh the screen to see how your graph has improved. Refer below screen shot to see the changes.
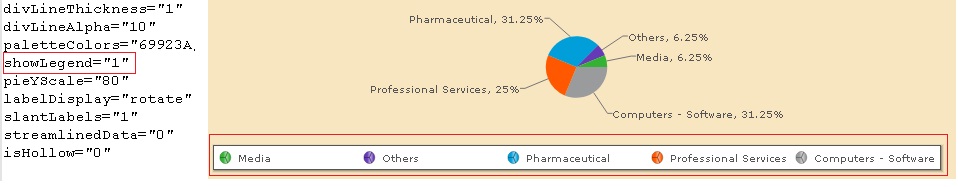
Show legend in Graph:
Open the Ergonomic.fsn file, find the showLegend=”0” line, and change the value from “0” Save the changes and refresh the screen to see how your graph has improved. Refer below screen shot to see the changes.
Rotate Graph:
You can do this by finding the enableRotation=”0″ line in Ergonomic.fsn file and change the value from “0” to “1”. Save your changes, refresh your screen and left-click and hold the cursor of your mouse on the graph to rotate the graph in the direction you move the mouse.
In this way, you can easily customize the graphs in the report and dashboards as per the requirement by making changes in .fsn file of FusionChart. Kindly note, that whenever you make the changes in Ergonomic.fsn file, changes will effect on all report graphs and dashboards available in CRM.
About Us
Greytrix – a globally recognized and one of the oldest Sage Development Partners is a one-stop solution provider for Sage ERP and Sage CRM organizational needs. Being acknowledged and rewarded for multi-man years of experience and expertise, we bring complete end-to-end assistance for your technical consultations, product customizations, data migration, system integrations, third-party add-on development, and implementation competence.
Greytrix has some unique integration solutions developed for Sage CRM with Sage ERPs namely Sage X3, Sage Intacct, Sage 100, Sage 500, and Sage 300. We also offer best-in-class Sage ERP and Sage CRM customization and development services to Business Partners, End Users, and Sage PSG worldwide. Greytrix helps in the migration of Sage CRM from Salesforce | ACT! | SalesLogix | Goldmine | Sugar CRM | Maximizer. Our Sage CRM Product Suite includes add-ons like Greytrix Business Manager, Sage CRM Project Manager, Sage CRM Resource Planner, Sage CRM Contract Manager, Sage CRM Event Manager, Sage CRM Budget Planner, Gmail Integration, Sage CRM Mobile Service Signature, Sage CRM CTI Framework.
Greytrix is a recognized Sage Champion Partner for GUMU™ Sage X3 – Sage CRM integration listed on Sage Marketplace and Sage CRM – Sage Intacct integration listed on Sage Intacct Marketplace. The GUMU™ Cloud framework by Greytrix forms the backbone of cloud integrations that are managed in real-time for the processing and execution of application programs at the click of a button.
For more information on our integration solutions, please contact us at sage@greytrix.com. We will be glad to assist you.