One fine feature of any business system is to generate profitability report in simple format for the decision makers in order to decide products or business segments to focus on. Sage 300 ERP does take care of this effortlessly using Selling Price/Margin Analysis Report in Inventory Control Module.
Let’s have a look at the working on this report in detail. Hence to view IC Selling Price/Margin Analysis Report screen navigate to Inventory Control >>I/C Price/Sales Analysis Reports >>Selling Price/Margin Analysis report.
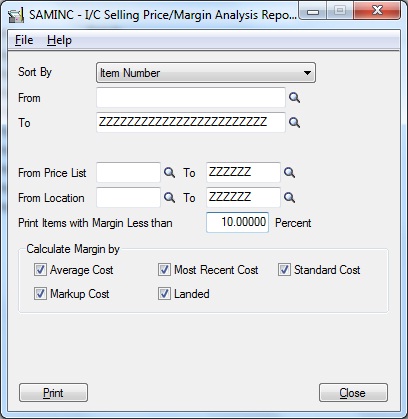
1. Report sorting criteria has multiple options like Item Number, Category, Item Segment, Price and many others including the master level optional fields (additional attributes) that you have defined for the items.
Hence, once you have selected an appropriate Sort option; select the From and To criteria, the desired Price List.
This way, you can shortlist the specific Price Lists to be printed and can analyze the margins against those price lists.
Say for an example, you have a separate price list defined for Retail Customers as against the wholesale ones. Here, you can print reports only for the specific price list and check the margins that you are able to generate for the mentioned prices.
It will help you to plan pricing strategy for the future dates and analyze the trends in Sales, based on the changes in prices.
2. Then, select Location[s] for which you wish to run the report.
Here you can select to print a specific set of items and price lists, where the margin appears below a certain level.
For an example; you can set ‘Print Items with Margin Less than’ to a specific percent to view the items which are giving you lesser margins as compared to others.
An efficient purchase manager can certainly try and reduce the costs to attain higher margins based on this data.
3. Further, select calculate margin by option; which would calculate Margin against Average Cost, Standard Cost or Landed Cost etc. by selecting the check boxes.
After selecting the right criterion you can print the report and check the output.
Also Read: Vendor Pricing Analysis in Sage 300 ERP
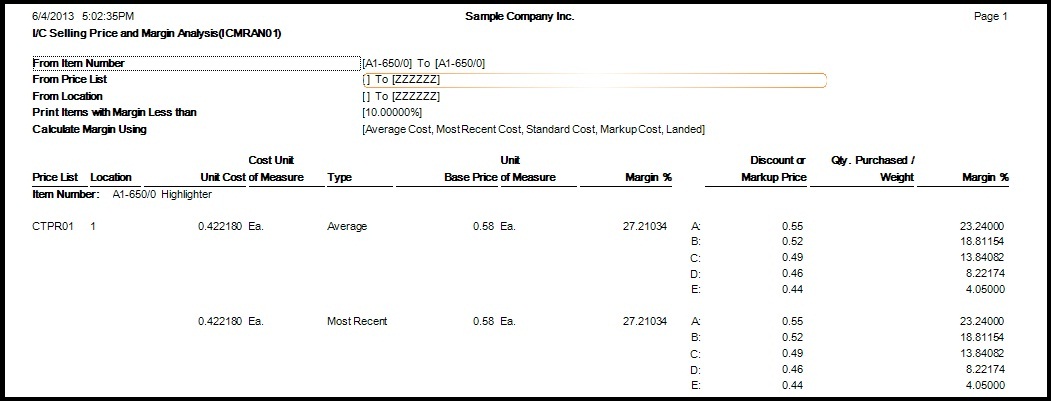
Report shows the summary of the fields as follows:
1. The top part of the report shows details such as Company name, date and time along with the criteria selected before printing the report.
2. Report displays Item wise, price list wise and location wise costs along with respective costing unit of measure.
3. Next to that, column named ‘Type’ displays the costing method specified for that item.
4. Base price is printed for each item UOM wise and then the Margin Percent against Unit Cost is displayed. Margin Percent is calculated based on costing method defined for the item.
5. The Margin percent displays your margin for the items that you are selling on Base Price. Whereas costing method would be displayed in Type column.
6. Then, Discounts or Markup Price column, will display the Markup price defined for the 5 sets (A to E) defined in Price Lists of I/C.
7. Finally, the last column shows the Margin % that is calculated on Markup Prices at all the 5 sets.
Having such exemplary report helped us make necessary changes in our pricing strategy; hence helping us to increase our margins.