Fusion charts in SageCRM improves the overall visual experience of reports. We can use the Fusion chart in Dashboard, blocks and Standard reports. Also, we can use different features of the Fusion chart i.e. Slicing Movement and Printing intelligent label management, custom tooltips, visually editable charts, multi-lingual charts etc.
New Stuff: Cloning Interactive Dashboard
In this blog will explain you how to set the background color for fusion chart report.
To set the colour follows the below path
1) Go to“<installation path>\WWWRoot\Themes\FusionChart\Color
2) Open the fsn file.
3) Find bgColor property.
4) Set the bgColor=”#FFFFFF”
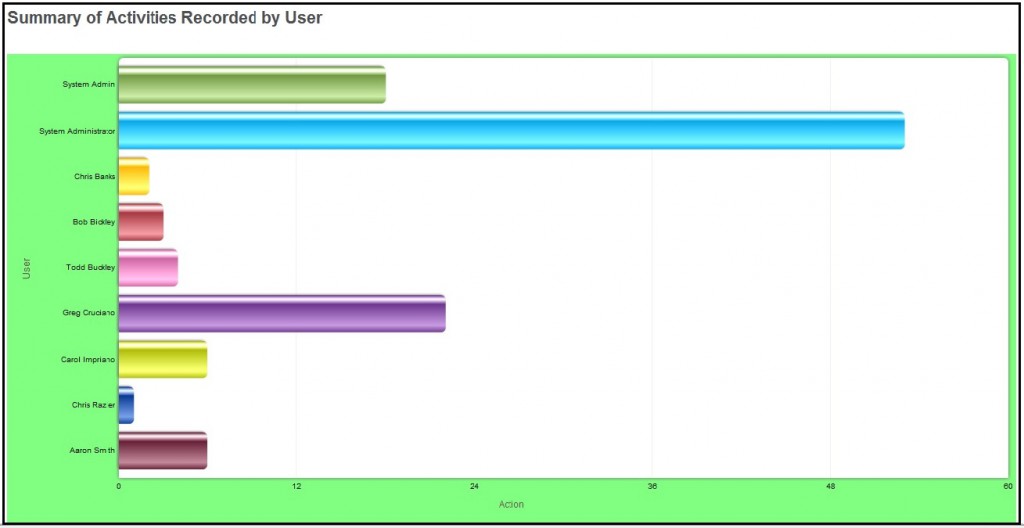
5) After changing the script close the browser and log into Sage CRM. You will get the Background Color in the Fusion chart.
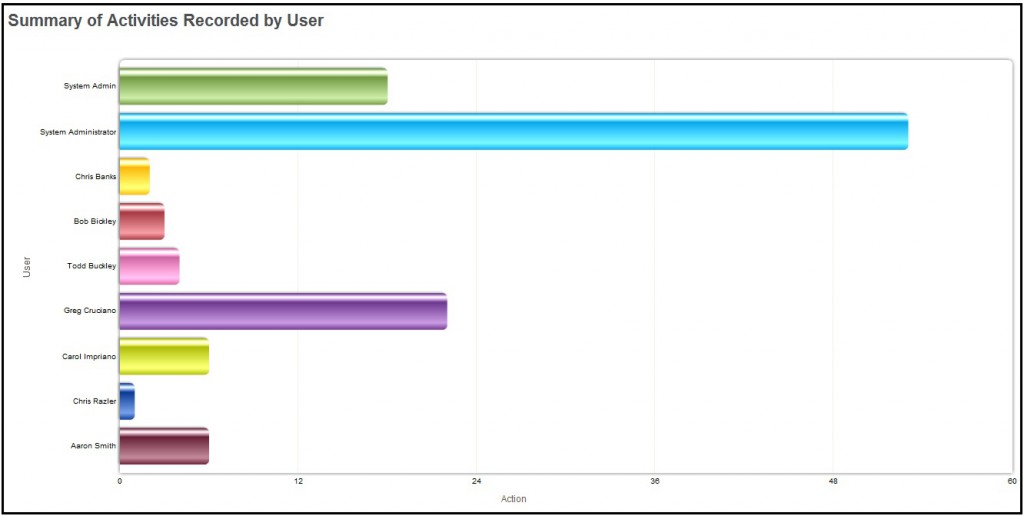
See the below screen shot before changing the script-

See the below screen shot after changing the script-

About Us
Greytrix is one stop solution provider for Sage ERP and Sage CRM needs. We provide complete end-to-end assistance for your technical consultations, product customizations, data migration, system integrations, third party add-on development and implementation expertise.
Greytrix has some unique integration solutions for Sage CRM with Sage ERP’s (Sage X3, Sage 100, Sage 500 and Sage 300). It also offers best-in-class Sage ERP customization and development services to Business Partners, End Users and Sage PSG worldwide. Greytrix helps in migrating to Sage CRM from ACT, Goldmine and other CRM’s.
For more information on our integration solutions, please contact us at sage@greytrix.com. We will be glad to assist you.
Also Read:
1) View Fusion Charts on Sage CRM Interactive Dashboards
2) Adding drill-down links to Fusion Charts
3) XML based Fusion Charts using .NET API
4) XML based Fusion charts in COM API
5) Monitoring Sales Team performance with the help of Dashboard
Sage CRM – Tips, Tricks and Components
Explore the possibilities with Sage CRM insights through our comprehensive blogs. As a leading Sage partner, Greytrix helps businesses maximize their Sage CRM potential with its rich expertise and immense knowledge. Here, you will find blogs that feature expert advice, tips & tricks, best practices, and comprehensive guides on customizing and configuring Sage CRM for your business. Stay informed with our regular updates and expert insights!


Pingback: ค่าน้ำบอล คืออะไร สำคัญยังไง ?
Pingback: pg333
Pingback: SLOT TRUE WALLET ไม่มีขั้นต่ำ
Pingback: ft lauderdale boat rentals with captain
Pingback: วิธีการเข้าซื้อ หวยกองสลากพลัส
Pingback: หวยสด Huaysod เว็บเล่นหวยออนไลน์ อันดับ 1 ดีไหมถ้าเปรียบกับ LSM99
Pingback: เว็บพนันบอล ดีที่สุด ต้อง LSM99
Pingback: massage Bangkok
Pingback: เว็บตรงฝากถอนง่าย
Pingback: Werewolf\'s Hunt
Pingback: pg168
Pingback: Aviator for Indian players
Pingback: fear of god essentials
Pingback: endolift
Pingback: pinco
Pingback: พลาสติกปูพื้นก่อนเทคอนกรีต
Pingback: sitio web oficial del juego Plinko Chile
Pingback: รับซื้อแบรนด์มือสอง
Pingback: เหยี่ยวไล่นก
Pingback: Aviator