As we all know that term “Dashboard” nowadays has become the most important part of any software or meeting. Within Sage CRM, we also have a feature to create personalized dashboard for Managers, Sales Executives and CEO’s.
In this blog, we will see how we can make use of a Gadget which will help Sales Managers to keep an eye on the Monthly Leads generated by Sales Team.
New Stuff: Filtering City based on selected State
To create any gadget in CRM, we have to create a SQL View which will then be used to create a report in Sage CRM. Well, to display the count of leads generated in a particular month I have added the following View against Lead Entity.
SQL View:
CREATE VIEW vLeadsForYear
AS
select MONTH(lead_opened) as CreatedMonth,
Case MONTH(lead_opened)
when 1 then ‘1.Jan’
when 2 then ‘2.Feb’
when 3 then ‘3.Mar’
when 4 then ‘4.Apr’
when 5 then ‘5.May’
when 6 then ‘6.Jun’
when 7 then ‘7.Jul’
when 8 then ‘8.Aug’
when 9 then ‘9.Sep’
when 10 then ’10.Oct’
when 11 then ’11.Nov’
when 12 then ’12.Dec’
end as CreatedMonthName,lead_leadid as LeadId
from lead (nolock)
where DATEPART(YY,lead_opened) = DATEPART(YY,GETDATE())
and lead_deleted is null and (Lead_ChannelId=(TEAM ID)
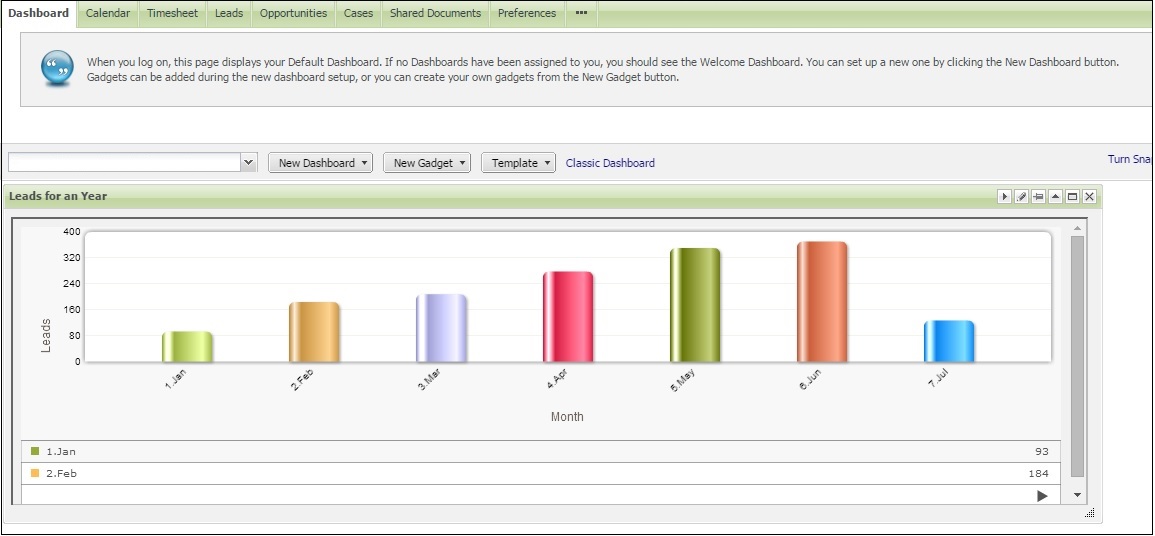
Once the above SQL view is added to any report, gadget can be added to a Dashboard which will look like as below.
Hope this helps!!
Also Read:
1. Actual vs Target Meter Dashboard Year wise
2. Sales KPI dashboard in Sage CRM 7.3
3. View Fusion Charts on Sage CRM Interactive Dashboards
4. 360° Customer View on Sage CRM Interactive Dashboards
5. User specific data on Interactive dashboards
Sage CRM – Tips, Tricks and Components
Greytrix is one of the oldest Sage Development Partner of two decades for Sage CRM and has been awarded "Sage Development Partner of the Year" three times in the past years. Greytrix has been working on customization and configuration of products in Sage CRM since decades and have accumulated hundreds of man years of experience. In these blogs, Greytrix will endeavour to share its knowledge and expertise and save upto 90% of project cost for Sage CRM users by presenting a list of useful small components, tools and add-ons for Sage CRM! Contact us at sage@greytrix.com
Greytrix is one of the oldest Sage Development Partner of two decades for Sage CRM and has been awarded "Sage Development Partner of the Year" three times in the past years. Greytrix has been working on customization and configuration of products in Sage CRM since decades and have accumulated hundreds of man years of experience. In these blogs, Greytrix will endeavour to share its knowledge and expertise and save upto 90% of project cost for Sage CRM users by presenting a list of useful small components, tools and add-ons for Sage CRM! Contact us at sage@greytrix.com


Iconic One Theme | Powered by Wordpress