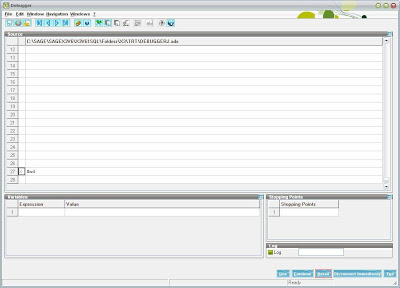
Sage X3 has a robust design that provides even the non technical users/ administrators to easily create custom fields and display/ hide fields in Sage X3 screens. The challenging task here is to identify the Table that is being used and finding the screen to which you need to add the field. To overcome this challenge, we would like to introduce you to the Sage X3 debugger that gives complete information when invoked over a screen. For e.g. if you are viewing the Sales Order Screen and you need information of the screen, just invoke the debugger and the below debugger screen will be loaded. The Sage X3 debugger can be invoked by pressing Ctrl +Alt + F keys altogether. Please note you need to have Administrative permission or users that belong to the module SUP (Supervisor) and to the group DEV (Development) can invoke the debugger.
Check Product: Sage X3 Development Services
-
The Variables Grid, this is similar to the Watch window wherein you can watch the value of Variables.
-
The Stopping Points Grid, this is very interesting (it is the same as using breakpoints) in case you do not want to step through each line of code, you can just type in the Code Line Number in this grid and click on continue, the program will break/ stop when it reaches that line number.
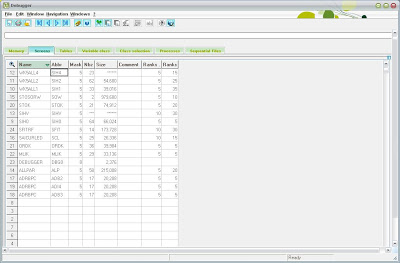
- Clicking on the Detail Button on the Sage X3 Debugger displays very useful information such as Memory used, Screen Objects, Tables, Processes, etc that is being used by the current process/ screen.
- Another quick way to identify the Screen/ Field Name is by invoking the Field Information screen from the Help a Diagnostic Help menu (This screen can also be invoked by pressing F6).
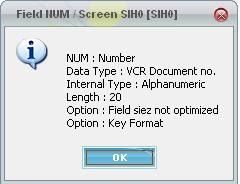
- Look at the window Title it shows you the screen name.
The Debugger has made many of the useful and regularly used operations handy. If you find this content useful, please drop us an email at x3@greytrix.com.
About Us
Greytrix – a globally recognized and one of the oldest Sage Development Partners is a one-stop solution provider for Sage ERP and Sage CRM organizational needs. Being acknowledged and rewarded for multi-man years of experience and expertise, we bring complete end-to-end assistance for your technical consultations, product customizations, data migration, system integrations, third-party add-on development, and implementation competence.
Greytrix has some unique integration solutions developed for Sage CRM with Sage ERPs namely Sage X3, Sage Intacct, Sage 100, Sage 500, and Sage 300. We also offer best-in-class Sage ERP and Sage CRM customization and development services to Business Partners, End Users, and Sage PSG worldwide. Greytrix helps in the migration of Sage CRM from Salesforce | ACT! | SalesLogix | Goldmine | Sugar CRM | Maximizer. Our Sage CRM Product Suite includes addons like Greytrix Business Manager, Sage CRM Project Manager, Sage CRM Resource Planner, Sage CRM Contract Manager, Sage CRM Event Manager, Sage CRM Budget Planner, Gmail Integration, Sage CRM Mobile Service Signature, Sage CRM CTI Framework.
Greytrix is a recognized Sage Champion Partner for GUMU™ Sage X3 – Sage CRM integration listed on Sage Marketplace and Sage CRM – Sage Intacct integration listed on Sage Intacct Marketplace. The GUMU™ Cloud framework by Greytrix forms the backbone of cloud integrations that are managed in real-time for the processing and execution of application programs at the click of a button.
For more information on our integration solutions, please contact us at sage@greytrix.com. We will be glad to assist you.