Cross-tab reports in Sage X3 are a versatile feature for summarizing and analyzing multidimensional data in a compact, matrix-like format. Similar to pivot tables in spreadsheet tools, they organize data with rows and columns representing different categories or variables, while the intersecting cells display aggregated values such as sums, averages, counts, or other calculations. In Sage X3, crosstab reports are powered by Crystal Reports, the integrated reporting engine that allows for dynamic, customizable outputs. This integration enables users to pull data directly from Sage X3’s database tables, apply business logic, and generate professional-looking reports that can be exported to formats like PDF or Excel. Key benefits include real-time visibility into processes (e.g., comparing supplier quotes against RFQ products in a dynamic row-column structure) and advanced features like formulas, conditional formatting, and sub-reports for deeper insights.
Recently, we received a requirement from one of our clients regarding a custom screen, EIR on Borrowing. On this screen, they want a report on the Effective Interest Rate and Closing Balance in a dynamic row-and-column format with date filters.
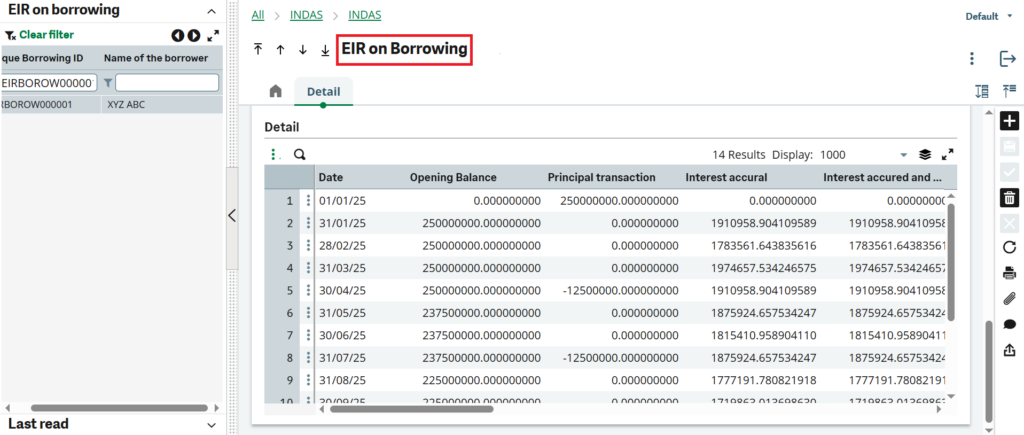
On the EIR on Borrowing screen in Sage X3 (as shown below), data is available in a detailed format for each borrowing entry:
- Fields: Date, Opening Balance, Principal Transaction, Interest Accrual
- Data Flow: Each line records periodic financial movement for a loan account.
New Stuff: Restricting User Access to Specific Sites in Sage X3
However, the finance team often needs to see this same data in a summarized, Excel-style matrix format, where each month appears as a column and each borrowing ID appears as a row — showing clear picture of interest accruals over time.
To implement the above requirement, please follow the steps outlined below:
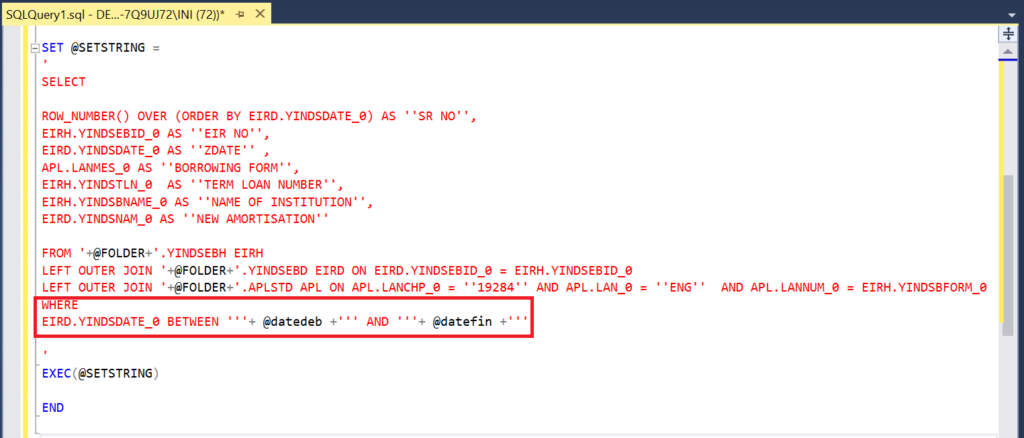
Step 01 – Create the SQL query that stores the values based on your WHERE condition. Here, we are filtering the data based on the date. Please find the attached screenshot for your reference.
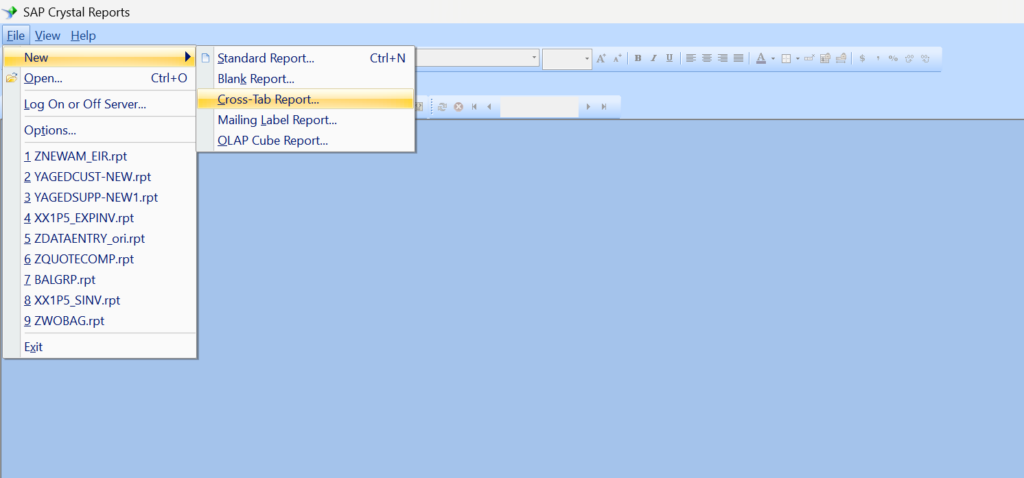
Step 02 – Open Crystal Reports, go to the File menu, select New, and choose Cross-Tab Report. As shown in the screenshot below.
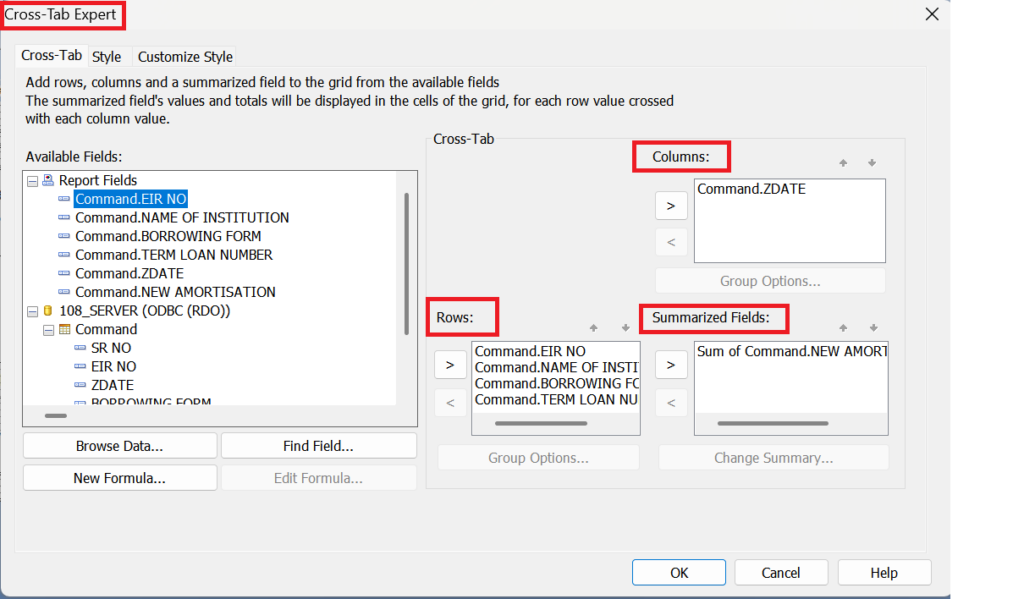
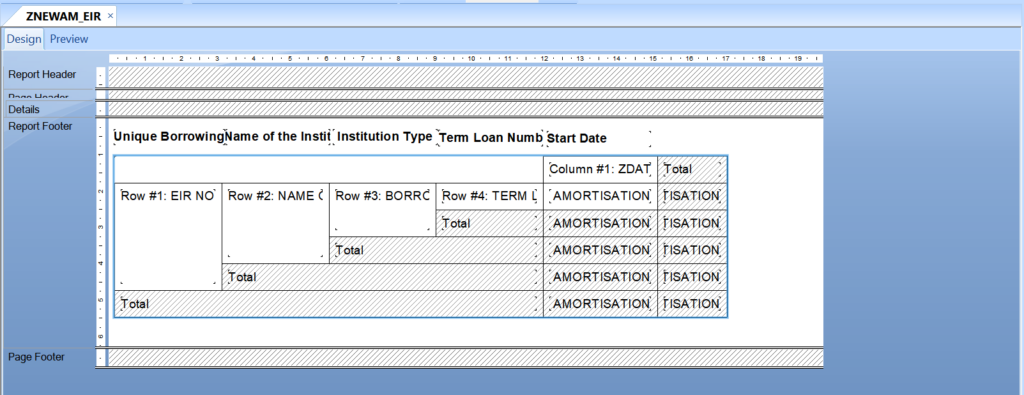
Step 03 – Since we have already fetched the fields as per the client’s requirements in the SQL query from the first step, our main aim is to display the Borrowing ID row-wise, corresponding to the date filters. As we are preparing the report below for the Effective Interest Rate, we will arrange the fields as shown in the screenshot below. Here, we have added some extra fields as per the client’s requirements.
Step 04 – Cross-tab report is a matrix style design so the more row-column data we add it’ll maintain a (nxn) design. So we suppress all the remaining duplicate data and delete the redundant columns-row pairs using the Cross-tab Expert menu to change the format to (nxm) design as below:
Step 05 – In below screenshot you will get desired output.
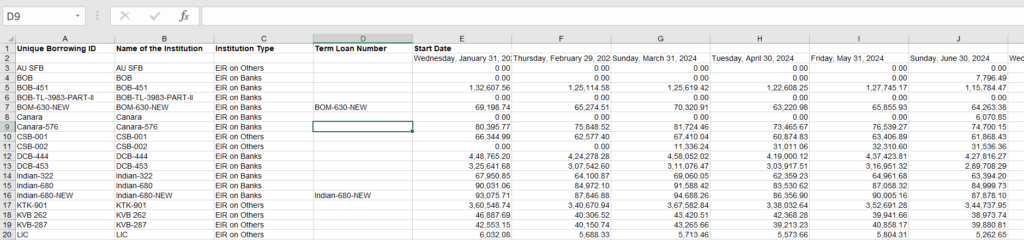
By using the above simple steps, we can easily create a cross-tab report with a dynamic row and column structure.
[about_us_blog_common]