In Sage X3, commission module provides enhancement of existing commission feature of Sage X3. It helps in overcoming challenges such as accuracy in sales commission calculation, timely payment to sales representatives, track of commissions of sales representatives, etc.
For any organization, sales play’s an important role in the success of the business. Sales representatives are the ones who generate the revenue for the organization and play a key role in the growth of business in any organization.
Sage X3 provides various types of representations for displaying records in the forms such as grid, graph, pie charts, etc. using features such as SQL query tool, graphical query tool, statistical parameters, etc. which makes it more responsive for a user environment.
Sometimes there might be a requirement of displaying data on user login. Sage X3 allows one feature of displaying such data which can be called as landing pages or dashboard.
Dashboard in sales commission module helps in motivating sales representatives and their teams by providing them visibility and vision on their sales target and on potential commission that they can earn during the defined period and win their trust by building transparency.
It helps in encouraging the sales representatives to achieve their pending targets. Also, it will help in comparing sales representative’s achievements for more progressive business decisions for a sales manager.
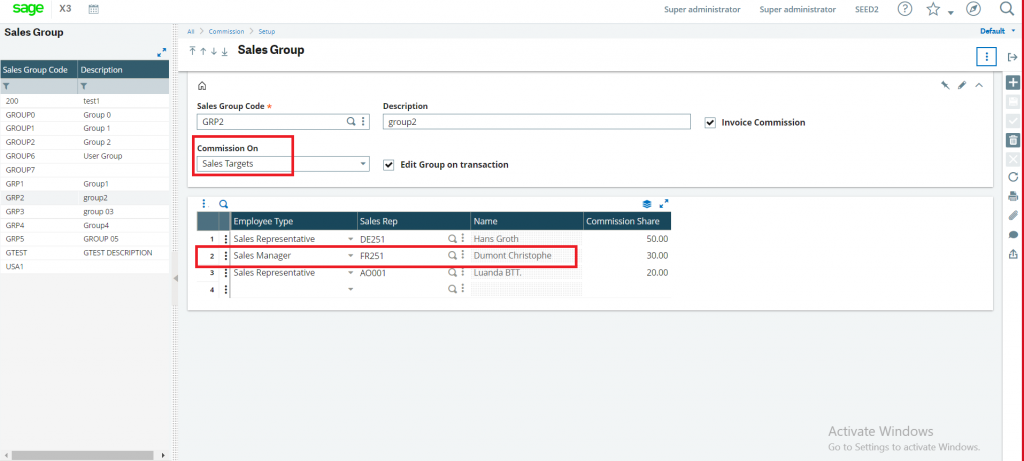
Sales commission module provides a feature of sales group which allows a particular sales representative to be defined as “Sales manager” using the ”Employee type” field and rest others to be its subordinates or just sales representatives during target setup in commission module as shown in below figure.

There can be multiple sales group in which a particular sales rep can be defined as manager for different set of sales representatives. The dashboard will display all the sales representatives for a particular user who is manager with all the records present in the system from all sales group where the user’s employee type is “Sales manager”.
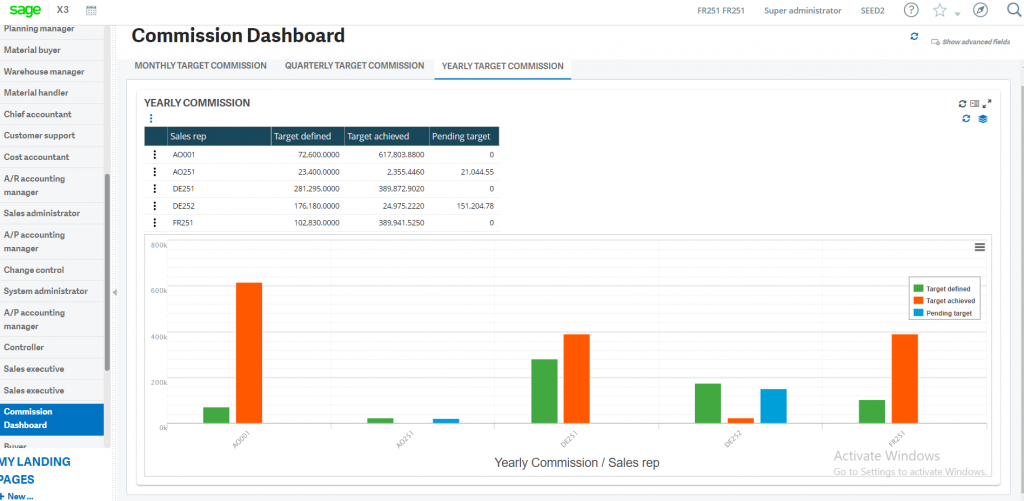
Consider an example where one sales representative is of employee type “Sales manager” and have few sales representative under it. When the manager logins to the system, the dashboard shows the manager sum of targets defined, targets achieved and how much the target is pending in its team for particular sales representative which will help in encouraging the sales representatives to earn their potential commission to achieve their pending targets in the particular span of time and will lead to growth in sales of the organization.

The dashboard includes three tabs which represent data records for span of a month, quarter or a year. In the monthly commission tab, the data will be displayed of the month of the current date. In the quarterly commission tab, the data will be displayed of the quarter as per current date falls in it and in yearly commission tab the data will be displayed of the year as per current date.

