In Sage X3, there are many ways to display records of transactions, customers or suppliers data and other masters data. So, sometimes users want to see the set of records like Sales Order, Sales Invoice, Purchase Invoice and many more when they login to the Sage X3.
Sage X3 allows one feature of displaying such data which can be called landing pages or dashboard.
This can be achieved using SQL query tool and Graphical query tool. But there was a requirement to add filters for the required fields in dashboard and to achieve this task we have created a view (We can create table as well), and used a class to manage the view, and made a representation of that class to show it as part of a menu.
Here are the steps to create Dashboard using view, class and representation:
Step 1 : Create View/Table(Exp : ZPINV)
Development -> Data & Parameters -> Views
Add query in SQL server field in Query tab
Add fields in Fields tab
Add a key code in Sort Keys tab
Save & Validate the view
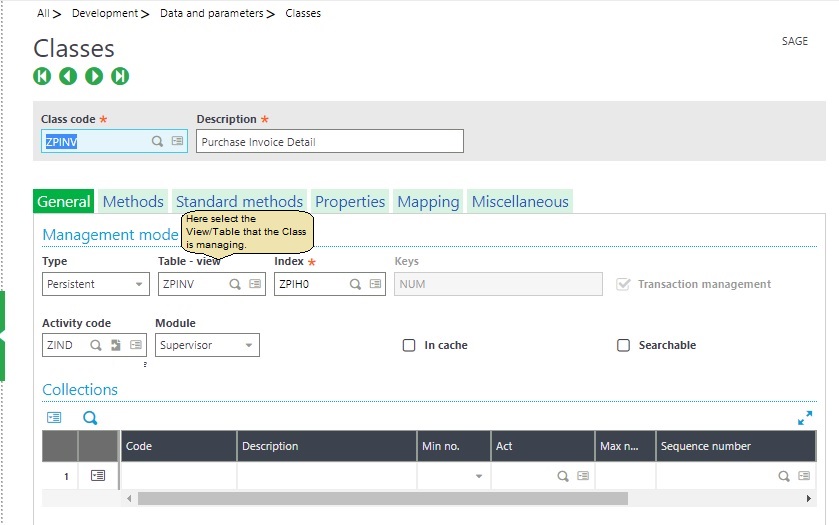
Step 2 : Create Class
Development -> Data & Parameters -> Classes -> Classes.
Click New.
Enter a class name, similar to the View/Table name.
Select Persistent as the type.
Enter the View(ZPINV) that you created on the 1st step as the table-view.
New Stuff: Partial quantity allocated Work order display in Operation tracking plan screen
Click on Properties tab and from the action select Column selection.
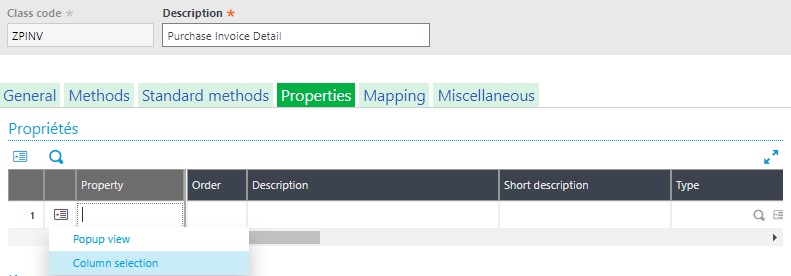
By default, everything on the table is marked as Yes, keep it that way and click Ok.
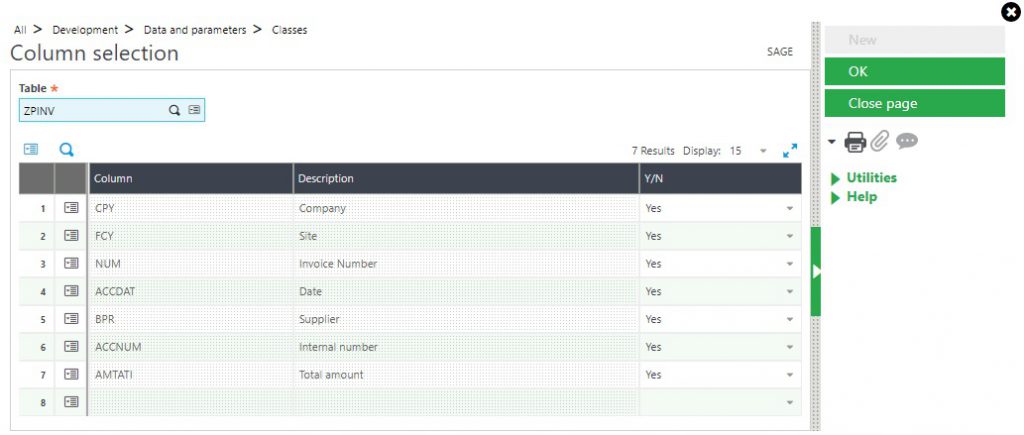
This will add all the table fields and properties on the class.
Click Create.
On the Standard Methods tab select all the methods that you like this class to manage (Creation, Deletion, Read, Modification etc).
Note : Method creation, deletion and modification are not compatible with View.
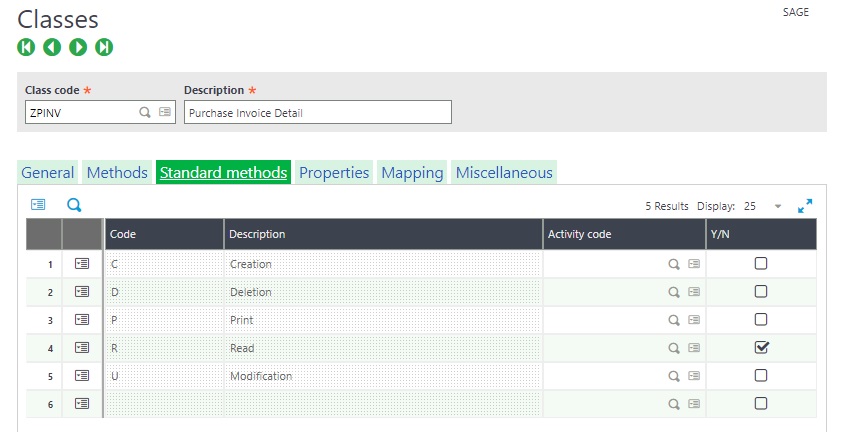
Click Save and Validation.
Step 3 : Create Representation
Development -> Data & Parameters -> Classes -> Representations
Click New
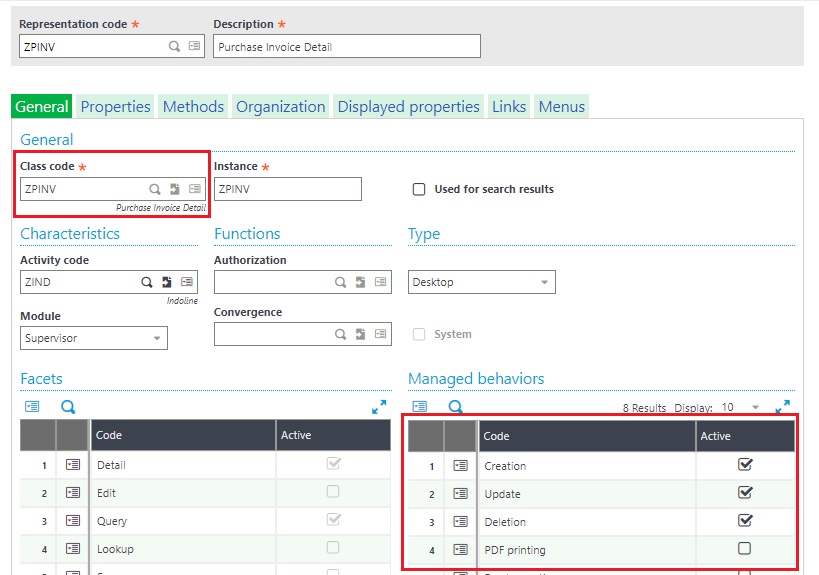
Enter a representation code and description
For the class select the class you created on 2nd step
Tick proper behaviors you like to be managed.
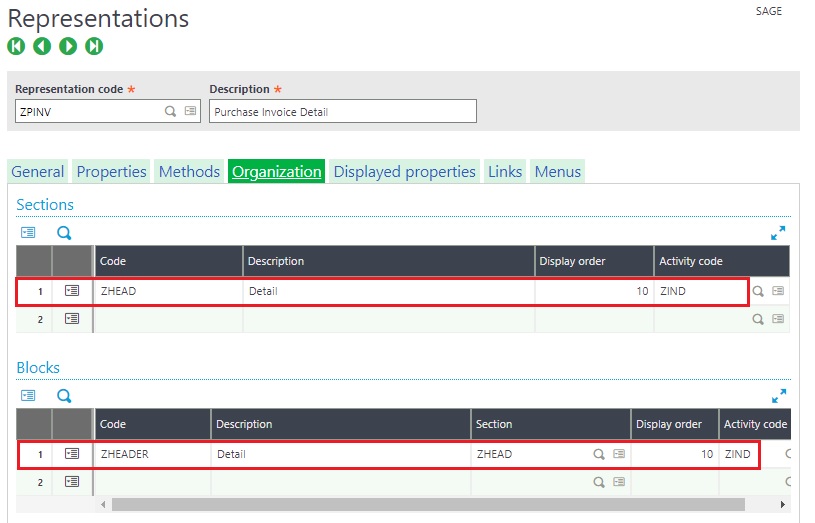
Create Sections and blocks in the Organization tab and, later on you will see how they will look like when you open the representation.
Click on the Displayed Properties tab.
For the Alias use the finder and select the properties of your class you like to display.
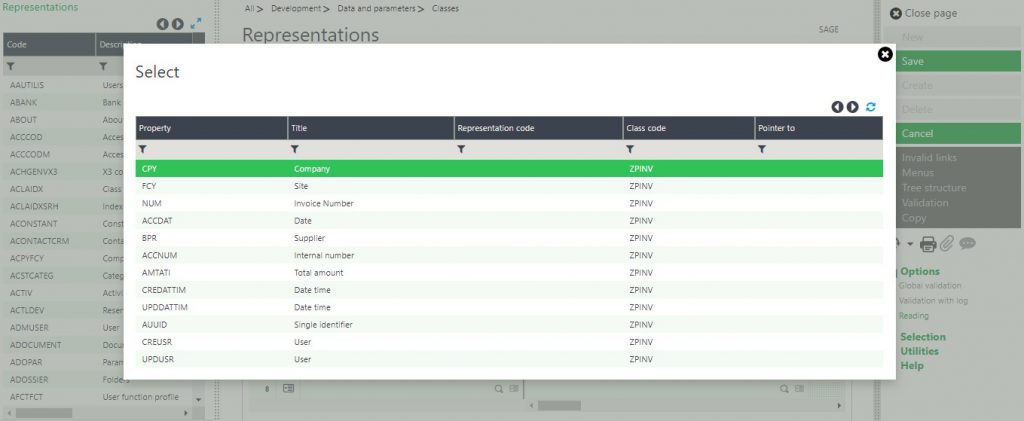
Select the block where you like this property to be displayed on.
Define what Facet you like this property to be displayed on, in this example, I have selected Detail, Edit and Query as Yes.
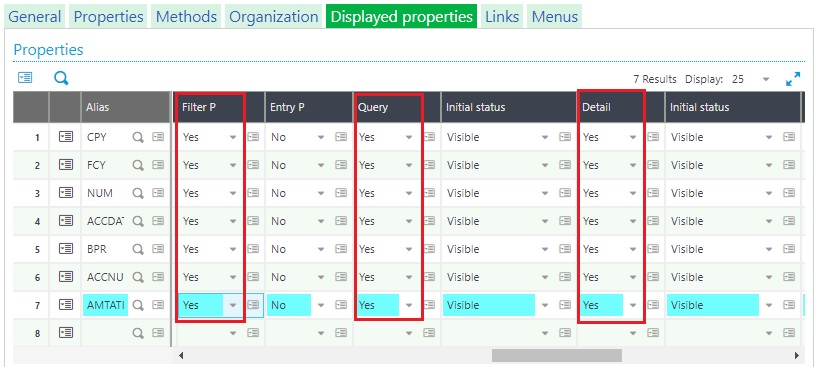
Click Save and Validate.
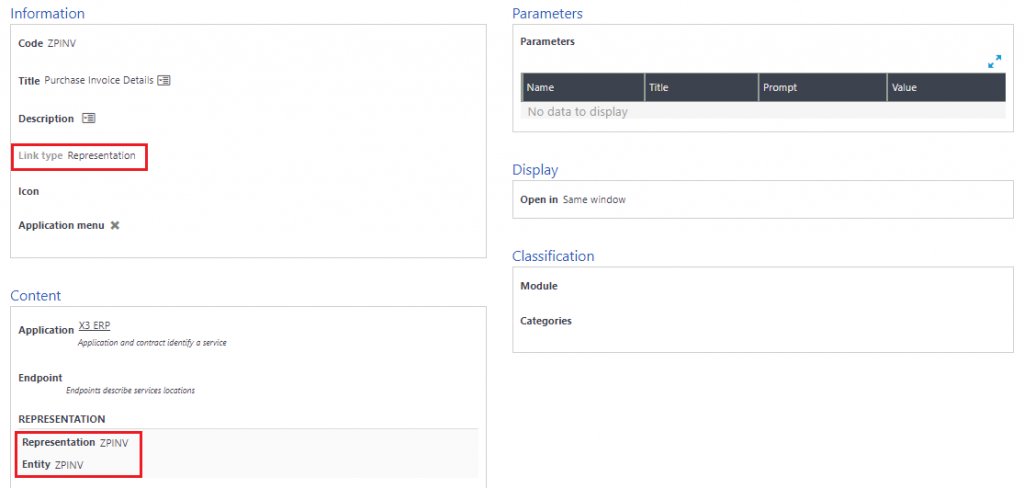
Step 4 : Create a Menu Item
Administration -> Authoring -> Pages -> Menu Items
Click New.
Enter a code and title.
Select Representation as the link Type.
Enter the name of the representation (ZPINV) for the Representation field and Entity field.
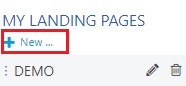
Step 5 : Added the Landing page on the home screen as below:
Click on New
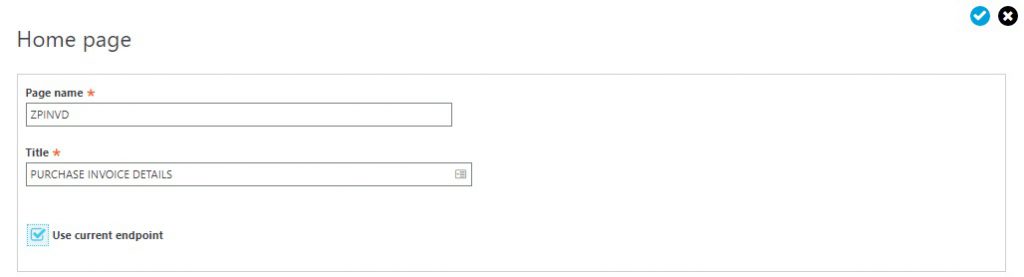
Enter Page name, title and tick ‘use current endpoint’ check box as below screenshot:
We will get the newly added menu item in the Representations as shown below:
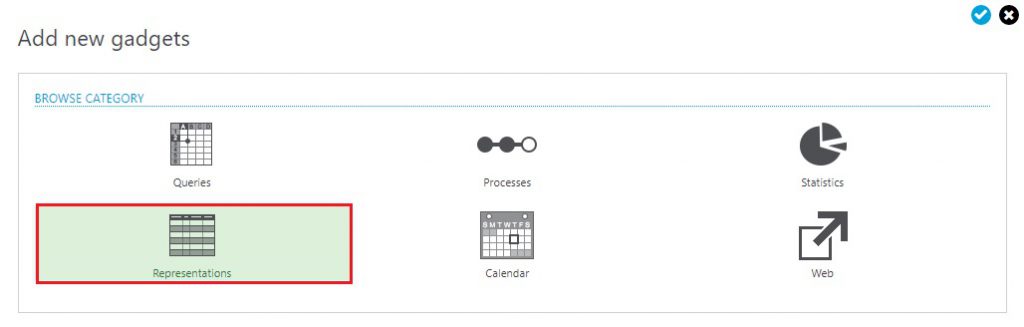
Follow the below navigation to get the gadget :
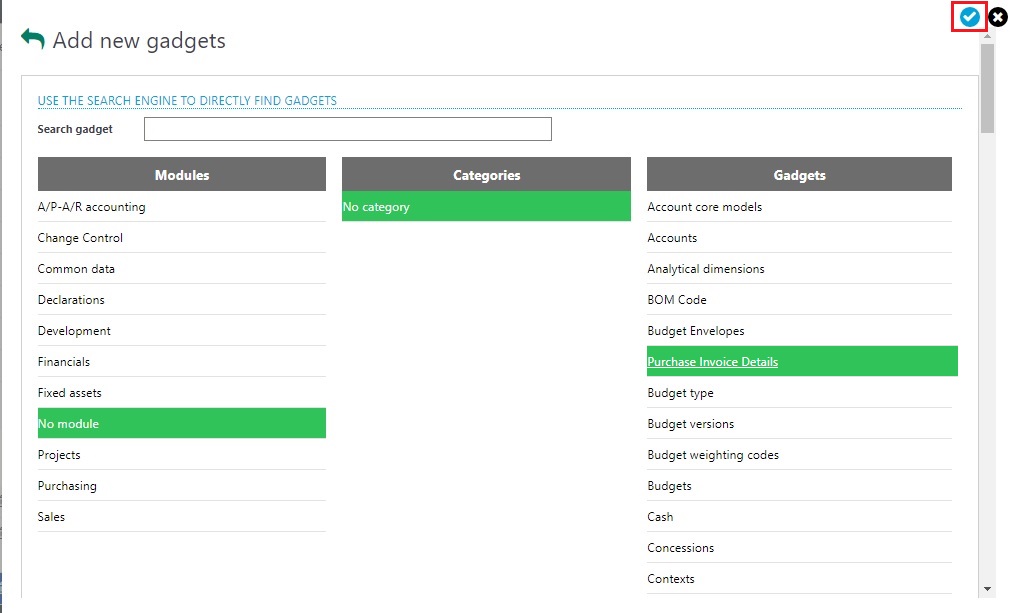
Find the below output of dashboard:
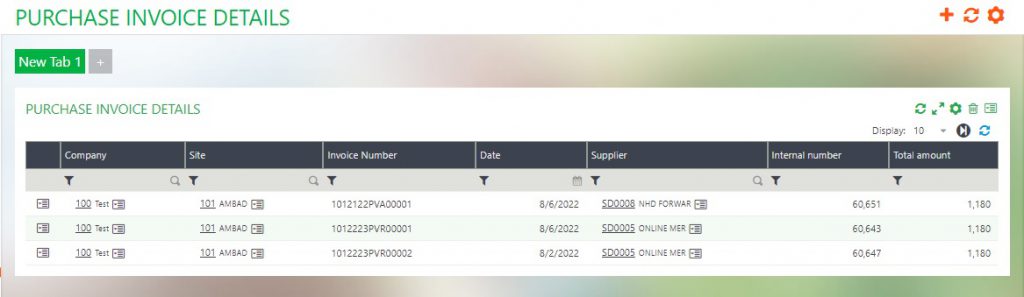
This is how we can create a dashboard using Classes & Representations in Sage X3.
About Us
Greytrix – a globally recognized and one of the oldest Sage Development Partners is a one-stop solution provider for Sage ERP and Sage CRM organizational needs. Being acknowledged and rewarded for multi-man years of experience and expertise, we bring complete end-to-end assistance for your technical consultations, product customizations, data migration, system integrations, third-party add-on development, and implementation competence.
Greytrix has some unique integration solutions developed for Sage CRM with Sage ERPs namely Sage X3, Sage Intacct, Sage 100, Sage 500, and Sage 300. We also offer best-in-class Sage ERP and Sage CRM customization and development services to Business Partners, End Users, and Sage PSG worldwide. Greytrix helps in the migration of Sage CRM from Salesforce | ACT! | SalesLogix | Goldmine | Sugar CRM | Maximizer. Our Sage CRM Product Suite includes addons like Greytrix Business Manager, Sage CRM Project Manager, Sage CRM Resource Planner, Sage CRM Contract Manager, Sage CRM Event Manager, Sage CRM Budget Planner, Gmail Integration, Sage CRM Mobile Service Signature, Sage CRM CTI Framework.
Greytrix is a recognized Sage Champion Partner for GUMU™ Sage X3 – Sage CRM integration listed on Sage Marketplace and Sage CRM – Sage Intacct integration listed on Sage Intacct Marketplace. The GUMU™ Cloud framework by Greytrix forms the backbone of cloud integrations that are managed in real-time for the processing and execution of application programs at the click of a button.
For more information on our integration solutions, please contact us at sage@greytrix.com. We will be glad to assist you.