In Sage X3, one of the client’s requirement was to have a “comparison report for Quality Variance” which will print from the Quality control screen. This report will be used to compare the quality of the product whether it passes or fails in the given range.
We will see the functionality in detail:
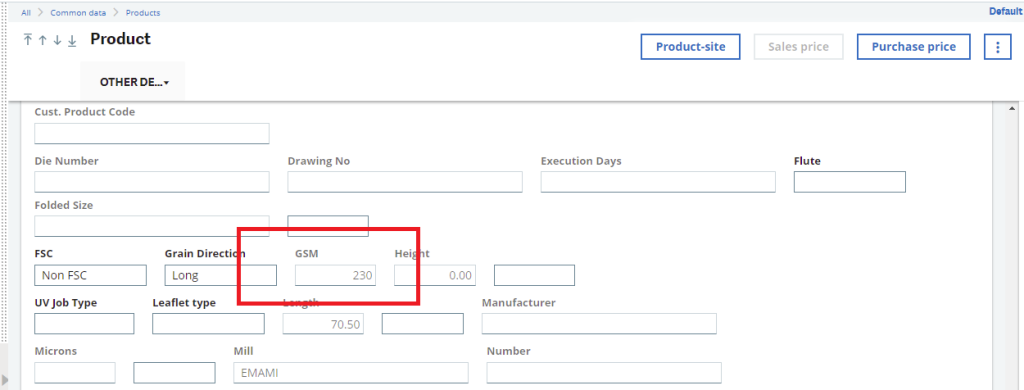
Navigate to: Common data -> Product master -> Other Detail
The GSM field is added in the product master which will be directly fetched in the Standard observation column of the Incoming Inspection Report. Now whether this Question is passed or Fail will depend upon the calculation and customization which we have done in the Question Master screen.
Navigate to: Common data -> Product tables -> Quality Record
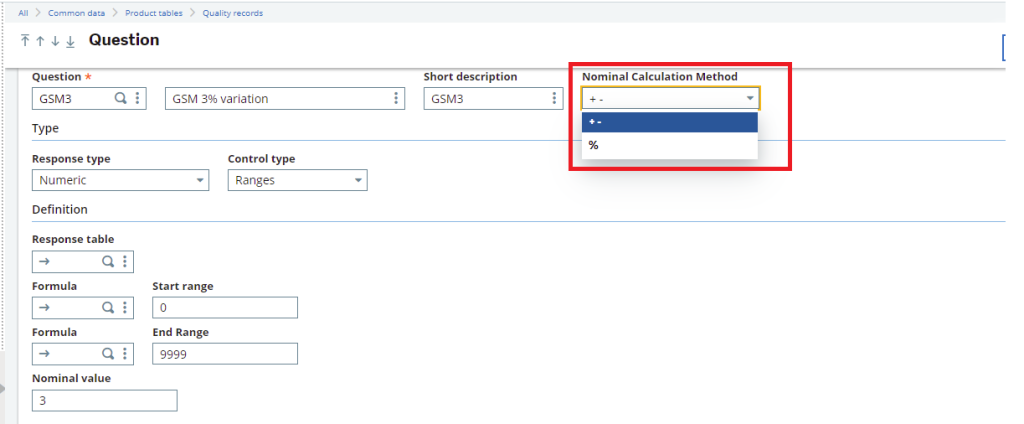
We have added the new drop down field “Nominal Calculation Method” in the Question master screen with two choices “+,- ” or “%” as shown in the above screenshot.
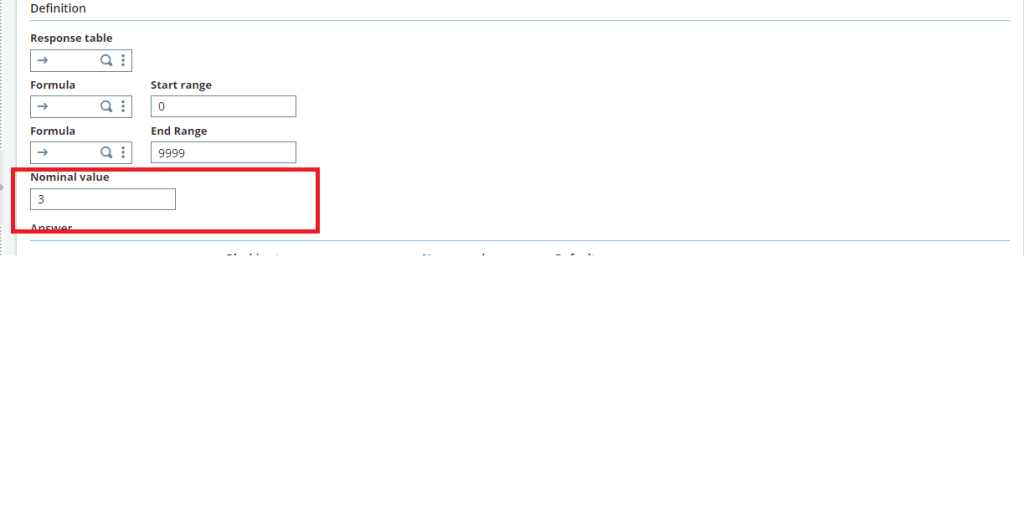
Navigate to: Common data -> Product table -> Quality record
Now there are two scenarios which we would consider for calculating Range in the report as shown
Scenario: 1
The Logic for “%” in the Range column of the report is:
Std observation * Nominal value / 100 = X
X – Std observation OR X + Std observation = Range
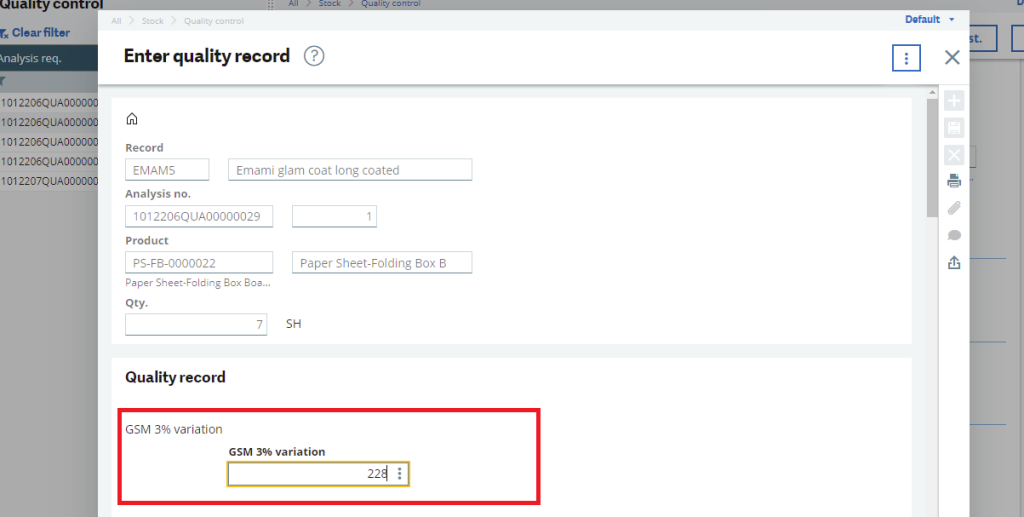
Where the additional fields are available in the other details tab of Product Master and those fields we will consider here as standard observation. And Actual Observation value is the observation which will be filled manually by the user in the Quality control screen for those fields that value will be considered as an actual observation value. Refer below screenshot.
Navigate : Stock -> Quality Control
So, we have to compare value of standard observation with the actual observation to find whether that case is passed/failed.
On the basis of the actual observation value and given set range the pass and fail of the quality of product will be decided.
Example:
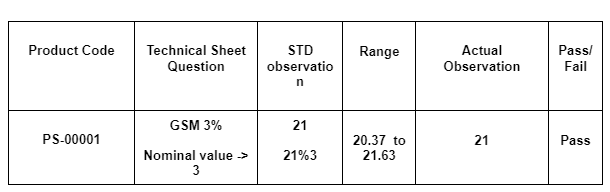
As you can observe in the above example, 21 is the STD observation of the GSM field which we will get from the product master. So our nominal value (i.e. 3) percentage will be calculated on this value i.e. 3% of 21 = 0.63 then From range is 21 – 0.63 = 20.37 and To range is 21+0.63=21.63.
Now, our actual observation is 21 which is falling between From-To range 20.37 To 21.63. Therefor this case will be passed.
But if the actual observation does not fall between the From-To range then that case will be failed.
Scenario: 2
Let’s assume if the user selects “+,-” then logic would be.
Std observation + Nominal value AND Std observation – Nominal value = Range
Example:
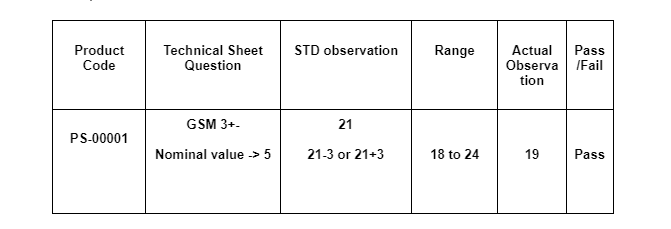
Here again, you can see, 21 is the STD observation of the GSM field. But “+,-” logic for nominal value will be considered. So nominal value ( i.e. 3) will be considered for “+,-” with 21.
From range is 21 – 3 = 18 and To range is 21 + 3 =24.
Now, our actual observation is 19 which is falling between From-To range 18 To 24. Therefor this case will be passed.
Below is the output of the Quality Variance Report:
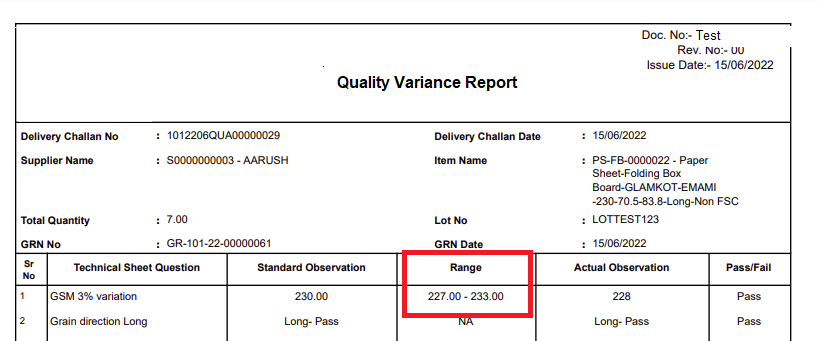
In this way, user will compare the Actual Observation and Standard observation on the single report easily.
About Us
Greytrix – a globally recognized and one of the oldest Sage Development Partners is a one-stop solution provider for Sage ERP and Sage CRM organizational needs. Being acknowledged and rewarded for multi-man years of experience and expertise, we bring complete end-to-end assistance for your technical consultations, product customizations, data migration, system integrations, third-party add-on development, and implementation competence.
Greytrix has some unique integration solutions developed for Sage CRM with Sage ERPs namely Sage X3, Sage Intacct, Sage 100, Sage 500, and Sage 300. We also offer best-in-class Sage ERP and Sage CRM customization and development services to Business Partners, End Users, and Sage PSG worldwide. Greytrix helps in the migration of Sage CRM from Salesforce | ACT! | SalesLogix | Goldmine | Sugar CRM | Maximizer. Our Sage CRM Product Suite includes addons like Greytrix Business Manager, Sage CRM Project Manager, Sage CRM Resource Planner, Sage CRM Contract Manager, Sage CRM Event Manager, Sage CRM Budget Planner, Gmail Integration, Sage CRM Mobile Service Signature, Sage CRM CTI Framework.
Greytrix is a recognized Sage Champion Partner for GUMU™ Sage X3 – Sage CRM integration listed on Sage Marketplace and Sage CRM – Sage Intacct integration listed on Sage Intacct Marketplace. The GUMU™ Cloud framework by Greytrix forms the backbone of cloud integrations that are managed in real-time for the processing and execution of application programs at the click of a button.
For more information on our integration solutions, please contact us at sage@greytrix.com. We will be glad to assist you.