Sage Enterprise Intelligence gives business users, managers and executives the power to analyze and create business reports, dashboards and views. In this blog we will have a look on how we can design data model and views in Sage Enterprise Intelligence.
In order to design report in SEI, Firstly we need to design data model and by using this data model we will create a views.
Below are the steps to design data model:
- In the command center section, Navigate to Data models and view.
- Create a new folder, here we will create a folder named as ZSALES. Refer the below figure
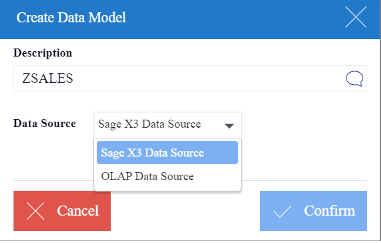
Inside this folder, We will create a data model, Click on the folder name and select new data model. Here we will create a data model named as ZSALES. Refer the below figure.

Data model is basically used for the linking of a table where we can link all those table for which we need to design a views.
To add a table , Click on insert > add table:
There will always be a table in the Data Model called as Fact Table, which is the starting table whose records always get returned regardless of whether there are corresponding records in the other linked tables.This table is labeled with the keywords Fact Table above the table name. By default, the first table added to a Data Model is set as the Fact Table.
It is possible to override this by right-clicking on one of the other tables and selecting Set as Fact Table.
The data can be previewed from any Tables/Views by right-clicking to select the option Preview Data. This will show the first 1000 records for the item selected.
Once the tables have been added and linked, fields can be added to the Data Model.
In order to add a fields on data model right-click on the Field to access to these options :
- Add Column,
- Join to Specific Values,
- Remove from Columns
Fields can be removed from the Data Model by right-clicking on the Field name and selecting Remove from Columns.
Calculated fields can also be added to a Data Model by selecting Add Calculated Column from the Insert drop-down menu or by clicking on the Add Calculated Column in the tool bar or by right-clicking in the Fields Table Section and selecting Add Calculated Column.
Dimensions and Measures: The Dimensions and Measures feature is used to preview all dimension, measures and descriptions related to the data model from the data model designer window. We can set the column as dimension, measures or description from column type properties in data model. Refer below figure.
Also there are many other properties such as subtotal, calculation, etc. Which we can be used based on the requirements. Once we have done with adding of all the required columns we can save the data model from the file drop-down menu.
This blog helps us to know how we can design the data models and properties of data models.

