In Sage X3, one of the client’s requirements was to have a comparison report for Quotes made by the suppliers for the given RFQ products. This report needed to have a dynamic nature of rows-columns design for which we’ve implemented the use of cross-tab option in Crystal report.
New Stuff: Weigh Bridge Integration in Sage X3
We’ll be referencing the following screens from Sage X3 for this:
RFQ: All > Purchasing > RFQs > RFQ (GESPQH)
Responses: All > Purchasing > RFQs > Responses (GESPPD)
Refer the screenshots for reference:
Note: The RFQ screen has two tables, one referencing the Products and other the Suppliers. Each supplier can give quote(s) for the given products which we can track from Response screens.
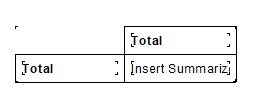
Step 1: In the Crystal report we need to design the report with a table having RFQ Products as rows and RFQ Suppliers as columns. As the no. of suppliers and products changes on the RFQ screen the report will automatically adjust the row-columns size. For this we require the cross-tab design (Insert > Cross-tab) and a basic design will show as follows:
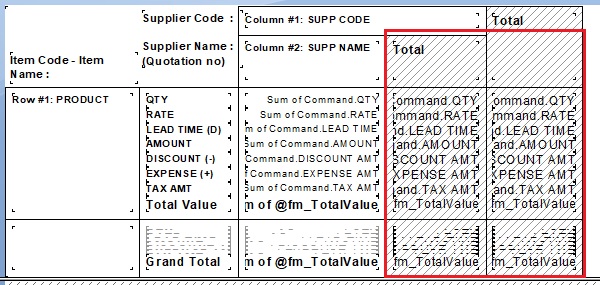
Step 2: We developed a SQL query which fetches Suppliers, products and other details from RFQ and Response screens as per client’s requirement. Our main rows comprises Products whereas the data corresponding to the product are Summarized rows next to it as shown below:
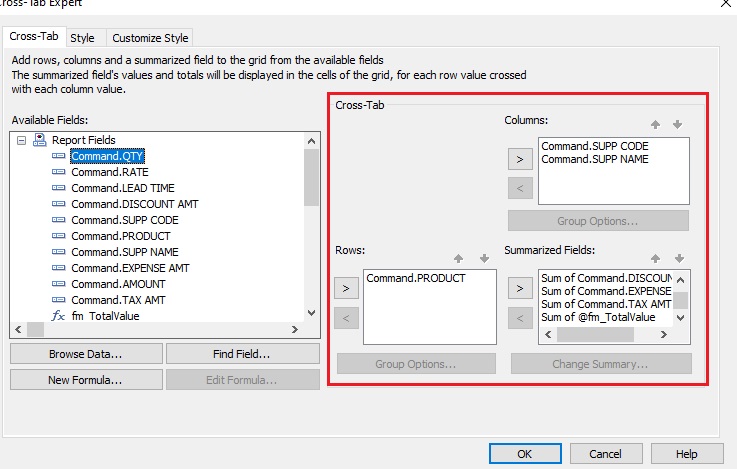
Step 3: Cross-tab report is a matrix style design so the more row-column data we add it’ll maintain a (nxn) design. So we suppress all the remaining duplicate data and delete the redundant columns-row pairs using the Cross-tab Expert menu to change the format to (nxm) design as below:
Step 4: Cross-tab table also provides a handful of Valuation options to implement such as row-wise grand totals, column-wise grand totals etc. So we also suppress such redundant totals using the Cross-tab Expert menu from the report as per our requirement.
Refer below a demo implementation of RFQ entry on report.
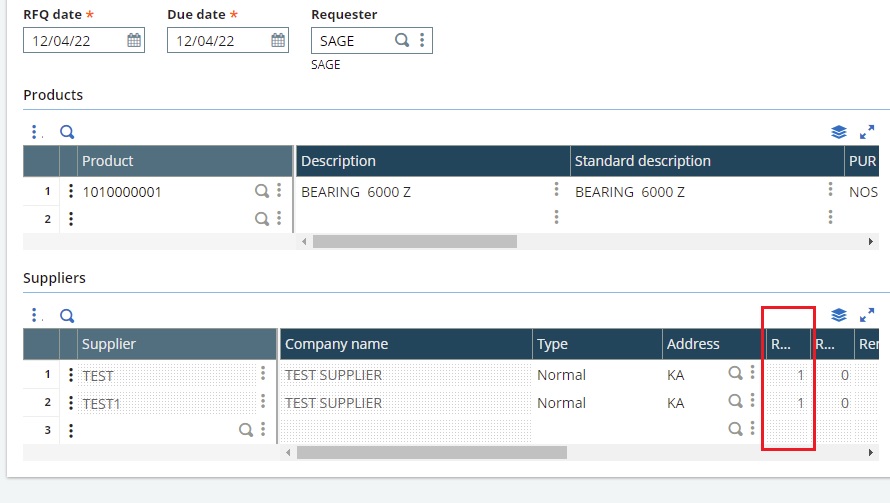
In the above RFQ entry, we’ve two suppliers giving 1 response for the product. So our report will be reflecting the different parameters based on the response data per supplier.
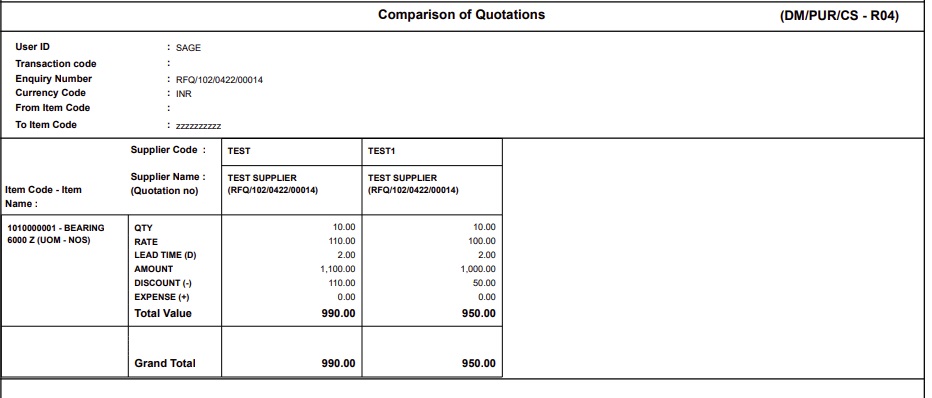
Here we can see the data in report format. If the products are added then the report will reflect that in rows and if more Suppliers are added then it’ll reflect in columns increment all automatically handled by Cross-Tab report.
Step 5: This way we have achieved a dynamic natured report requirement on Crystal report.
About Us
Greytrix – a globally recognized and one of the oldest Sage Development Partners is a one-stop solution provider for Sage ERP and Sage CRM organizational needs. Being acknowledged and rewarded for multi-man years of experience and expertise, we bring complete end-to-end assistance for your technical consultations, product customizations, data migration, system integrations, third-party add-on development, and implementation competence.
Greytrix has some unique integration solutions developed for Sage CRM with Sage ERPs namely Sage X3, Sage Intacct, Sage 100, Sage 500, and Sage 300. We also offer best-in-class Sage ERP and Sage CRM customization and development services to Business Partners, End Users, and Sage PSG worldwide. Greytrix helps in the migration of Sage CRM from Salesforce | ACT! | SalesLogix | Goldmine | Sugar CRM | Maximizer. Our Sage CRM Product Suite includes addons like Greytrix Business Manager, Sage CRM Project Manager, Sage CRM Resource Planner, Sage CRM Contract Manager, Sage CRM Event Manager, Sage CRM Budget Planner, Gmail Integration, Sage CRM Mobile Service Signature, Sage CRM CTI Framework.
Greytrix is a recognized Sage Champion Partner for GUMU™ Sage X3 – Sage CRM integration listed on Sage Marketplace and Sage CRM – Sage Intacct integration listed on Sage Intacct Marketplace. The GUMU™ Cloud framework by Greytrix forms the backbone of cloud integrations that are managed in real-time for the processing and execution of application programs at the click of a button.
For more information on our integration solutions, please contact us at sage@greytrix.com. We will be glad to assist you.