Introduction
When you look at raw data, it can be hard to understand what it all means because it’s just a bunch of numbers or information. It’s difficult to see patterns or trends when the data is in this simple form.
One tool that helps with visualizing data is called conditional formatting. This tool makes it easier to see patterns and trends in your data by applying different formats to cells based on their values. For example, you can set rules so that cells with high values are highlighted in one colour while those with low values are highlighted in another colour. This way, you can quickly identify areas of interest in your data. Conditional formatting turns raw data into a visual map, making it easier to read and analyse your data.
CONDITIONAL FORMATTING IN SAGE X3
Step 1
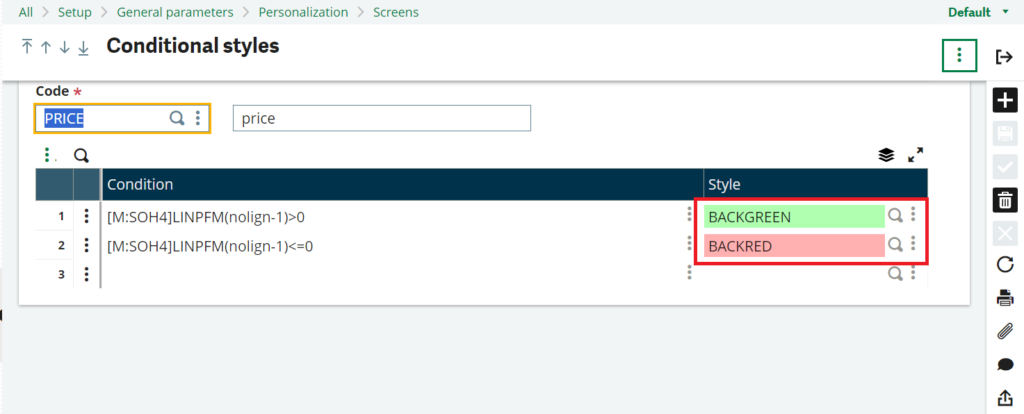
Define the criteria and the style. Enter a unique code, enter a description, and fill out the lines accordingly.
1. Fill Out the Lines Accordingly: This involves specifying how the information should be displayed based on whether the criteria are met. This could include setting the colour, text size, or other visual elements.
For example:
– Line 1: This line specifies the visual style when the price is greater than zero.
– Line 2: This line specifies the visual style when the price is less than or equal to zero.

Fig.1: Conditional Styles
Step 2
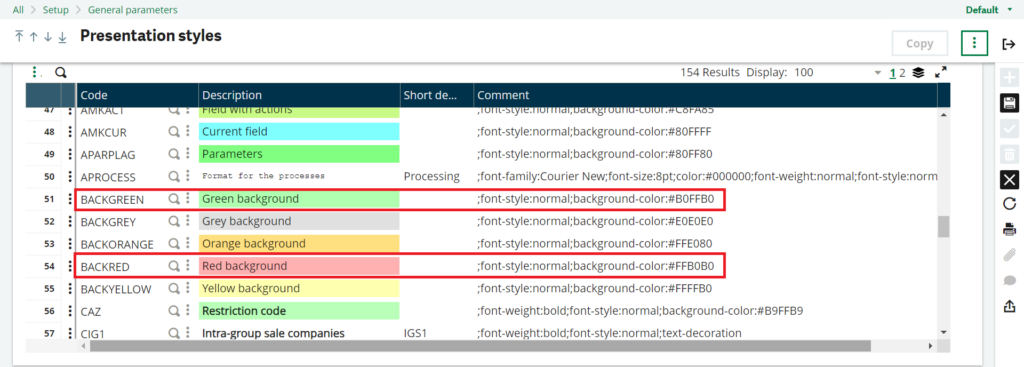
- Other Styles: In addition to the default styles that may be provided, there could be other options for you to try out. These options could include different colours, fonts, sizes, or other visual changes that alter the appearance of the information on your screen.
- Setup > General Parameters > Presentation Styles: Another way to access and customize styles is through a setup menu in the application. You can navigate to the “Setup” section, then choose “General Parameters,” and finally go to “Presentation Styles.” Here, you may find a range of options that let you modify how information is displayed in the application.

Fig.2: Presentation Styles
Step 3
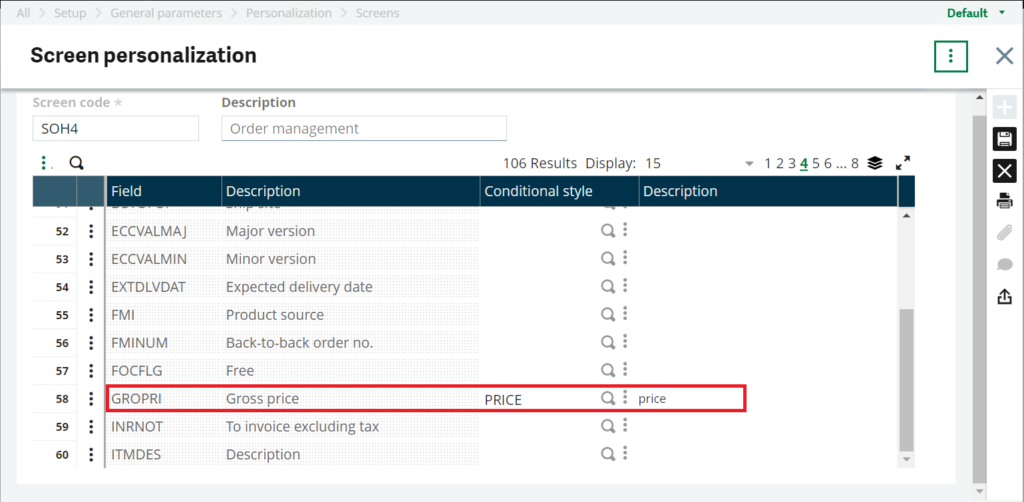
Assign the style to the field. Go to Setup–>General Parameters–>Personalization–>Screen–>Conditional Style assignment.
- Screen Personalization: Inside the Screen section, look for an option called “Conditional Style assignment” This is where you can customize the appearance of specific screens in the application.
- Enter the Screen Code: To customize a specific screen, you’ll need to enter the code or identifier for that screen.
- Assign the Style to the Field: Once you’ve entered the screen code, you can assign a specific style to a field on that screen. This might involve choosing a colour, font, size, or other visual elements to change how the field looks.
By assigning a style to a field, you can make that information stand out more or make it easier to read and understand.

Fig.3: Screen Personalization
Step 4
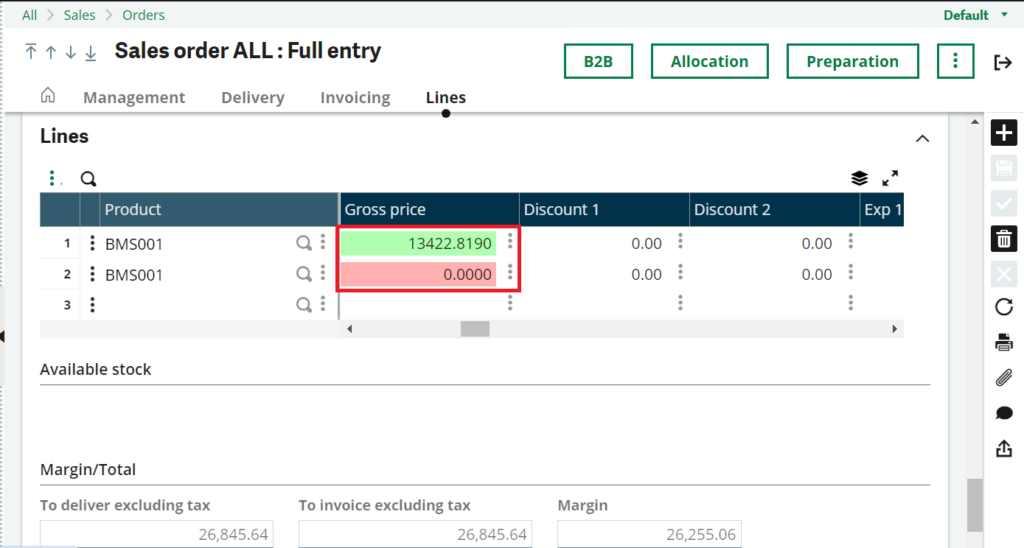
In our example scenario, we’ve set up a rule where the gross price field will display in green if the price is greater than zero. Conversely, if the price is not greater than zero, the gross price field will be displayed in red. By viewing the style in action, you’ll be able to confirm whether the applied rules are working as intended.

Fig.4: Sales Order Screen
Thus, conditional formatting in Sage X3 streamlines data visualization by allowing users to define criteria and styles, assign them to fields, and observe their impact on data interpretation. This process enhances data analysis by visually highlighting patterns and trends, making it easier to identify areas of interest within the dataset.

