One of the most valuable features within SEI is dashboard filtering, a dynamic function that allows users to customize their data views to meet specific analytical needs. Dashboard filtering in SEI for SAGE X3 provides users with the flexibility to focus on the most relevant data, thereby transforming vast datasets into actionable insights. Whether you are monitoring sales performance, inventory levels, or financial metrics, mastering dashboard filtering can significantly enhance your ability to make informed decisions swiftly and accurately. There might be scenarios where it gets difficult to filter dashboards in SEI.
In the below blog we are going to find out the best possible ways to filter a dashboard in Sage Enterprise Intelligence. Dashboard views can be filtered in below ways:
1. Filtering Panel.
2. Filtering using the Selection Page.
3. Filtering using the External Link.
4. Filtering on Click.
1. Filtering Panel:
One of the quickest ways to filter your dashboard, based on the list of the possible values of a field.
Note: For a Filtering Panel to be functional, at least one Global Parameter has to exist in the system. The Global parameter has to exist with a field within the data models where the dashboards views originate.
Follow the below steps to use Filtering Panel:
- In the Setting menu on the right panel, click on the icon (Edit Dashboard) to enter into edit mode.
- In the Edit menu, select Dashboard Properties.
- Open the Filtering Panel section of the Properties menu to view the filters. From here you can add, edit, remove or reorder the filters.
The remaining views in the dashboard can now be filtered automatically.
2. Filtering using the Selection Page:
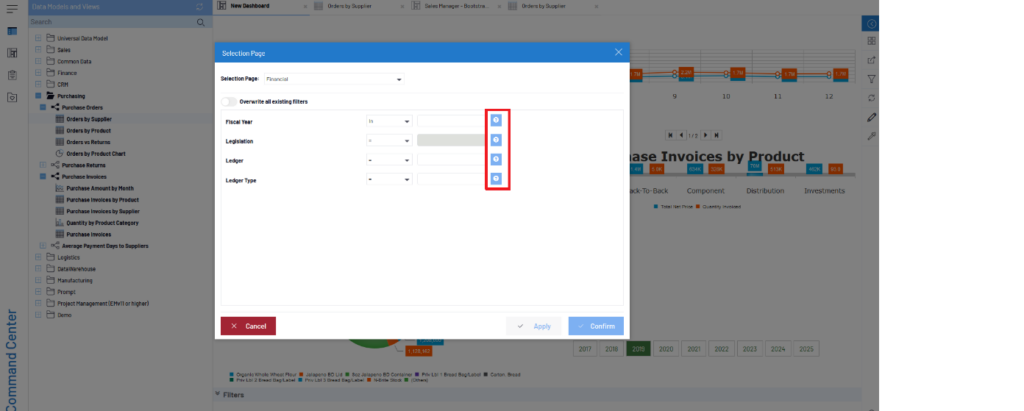
The dashboard can also be filtered via the Selection Page window by clicking on next to the prompts or by setting a prompt in the Prompt on open property of the dashboard. Refer the below screenshot:

3. Filtering using the External Link:
To filter a dashboard by year, insert the external link received at the end of the URL; for example: ‘&F=Year=2018’, Refer the below screenshot.
The dashboard will be updated with the specified year’s data only.

4. Filtering on Click:
It is possible to filter the content of the Dashboard by clicking on any value of any type of View that has been predefined in the Dashboard Designer.
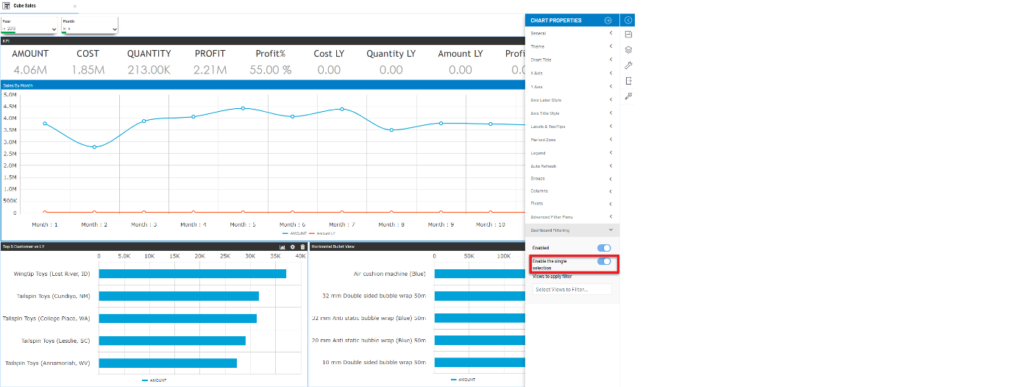
Note: Toggle the single-click selection in your dashboard to swiftly apply filters across different views (except Maps), enhancing your data analysis without disrupting your current view’s configuration. Refer the below screenshot.

Hope the above blog helps you with filtering your dashboard views. Using the above mentioned ways, you can filter your dashboard views and have a smooth experience making it easier to create customized SEI views that highlights the most important information, saving time and boosting the productivity.

