Using Sage Enterprise Intelligence, we can create reports, dashboards, and views. Also, we can analyze data easily in SEI. Sometimes user wants to view data in different format in SEI. In this blog we will see how to view data in different format in SEI.
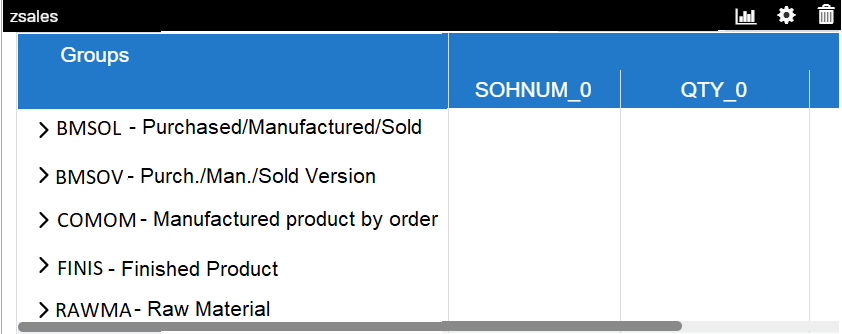
When a column is added to SEI dashboards and views, just the data code is displayed, as seen in Figure 1.
However, on sometimes, a user wants to add a title, a description, a code, or a combination of all four. Therefore, in order to do that, we must take the steps described below.
The following are steps to display data in different formats.
- You need to open the data model screen in SEI and select the field from the column screen as shown in fig 2.
- Next step to select description format from field which you want to add description code or title as shown in fig 2.
- you can see different formats to display data as follows.
- Title code description: Using this format it will display title means column name and code and description for that particular field having space between them.
- Title description code: Displays first title description then code with space.
- Title code: Displays only title and code with space.
- Title description: Displays only title and description with space.
- Code description: Displays only Code and description with space.
- Code: Displays only Code with space
- Description: Displays only description with space.
- Description code: Displays first description then code with space.
- Title-Code-Description: Displays title, code and description with dash.
- Title-Description-Code: Displays first title then description then code with dash.
- Title-Description: Displays only title and description with Dash.
- Code-Description: Displays only Code and description with Dash.
- Description-Code: Displays first description then code with Dash.
After setting the description format save the data model and add that field in dashboard or view. You can see the data as follows:
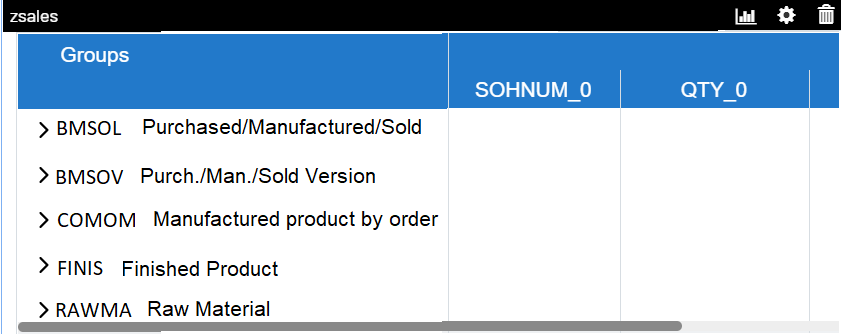
- As shown in figure 3, how data will be display in Code-description format.
2. In fig 4 you can see that how data will be display in code description.
By following above steps we can display data according to need in SEI dashboard and SEI view.
About Us
Greytrix – a globally recognized and one of the oldest Sage Development Partners is a one-stop solution provider for Sage ERP and Sage CRM organizational needs. Being acknowledged and rewarded for multi-man years of experience and expertise, we bring complete end-to-end assistance for your technical consultations, product customizations, data migration, system integrations, third-party add-on development, and implementation competence.
Greytrix has some unique integration solutions developed for Sage CRM with Sage ERPs namely Sage X3, Sage Intacct, Sage 100, Sage 500, and Sage 300. We also offer best-in-class Sage ERP and Sage CRM customization and development services to Business Partners, End Users, and Sage PSG worldwide. Greytrix helps in the migration of Sage CRM from Salesforce | ACT! | SalesLogix | Goldmine | Sugar CRM | Maximizer. Our Sage CRM Product Suite includes addons like Greytrix Business Manager, Sage CRM Project Manager, Sage CRM Resource Planner, Sage CRM Contract Manager, Sage CRM Event Manager, Sage CRM Budget Planner, Gmail Integration, Sage CRM Mobile Service Signature, Sage CRM CTI Framework.
Greytrix is a recognized Sage Champion Partner for GUMU™ Sage X3 – Sage CRM integration listed on Sage Marketplace and Sage CRM – Sage Intacct integration listed on Sage Intacct Marketplace. The GUMU™ Cloud framework by Greytrix forms the backbone of cloud integrations that are managed in real-time for the processing and execution of application programs at the click of a button.
For more information on our integration solutions, please contact us at sage@greytrix.com. We will be glad to assist you.