In Sage X3, one of the client’s requirements was to have a screen that’ll be used for the purpose of tracking Sales Invoice contents based on QR code label before the final process of Loading the goods in delivery transports, hence we’ve given it the name Loading Chart.
Furthermore, the customization provides a business solution in terms of a customized report to ease the process of preparing a final goods loading document that’ll provide in-depth details regarding the contents and the transport. To learn more about it, let’s take you through its working and user operations:
We’ll be referencing the following screen from Sage X3 for this:
Sales Invoice: All > Sales > Invoices > Invoices (GESSIH)
Refer the screenshots for reference:
Introduction to the screens & components linked:
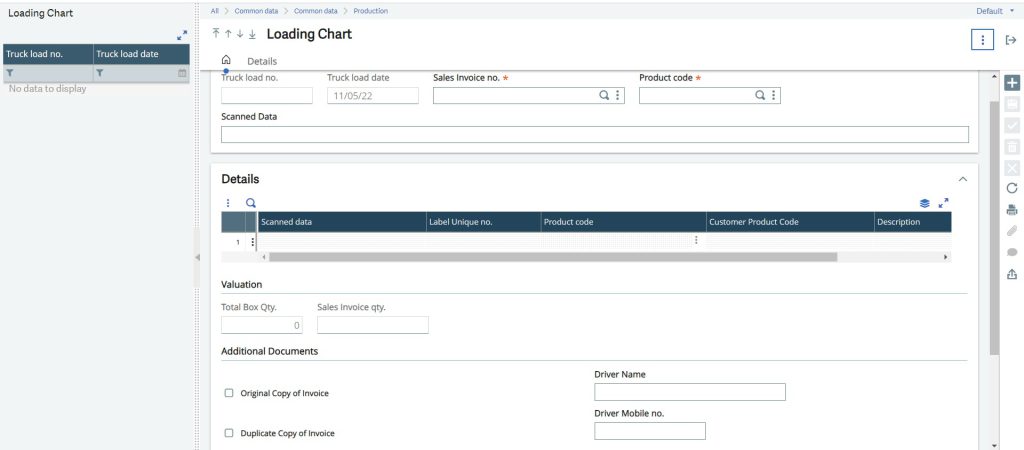
- To begin with we can go through how the screen UI looks and what are the various parts that are required for users to interact and enter. Below in Fig. 1 shows the Loading Chart main screens.
- The Header screen consists of 5 fields in which “Truck load no.” & “Truck load date” are automatically filled upon entry creation. The Detail screen consists of a data grid, Valuation block and optional Additional documents info provided for users to fill.
New Stuff: Valuation price null not authorized
Working & Process of entry creation:
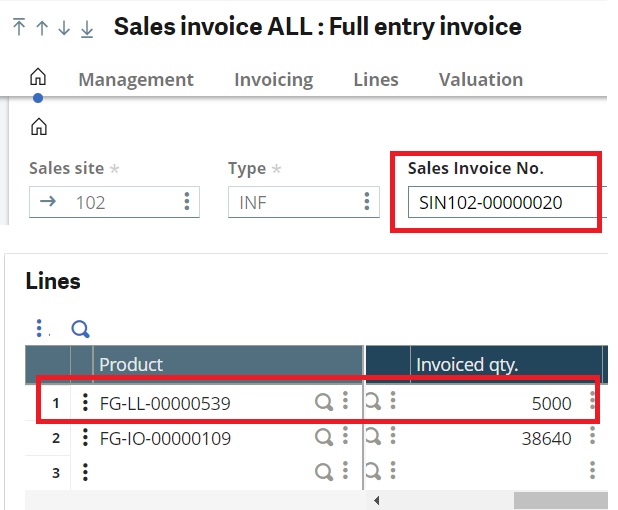
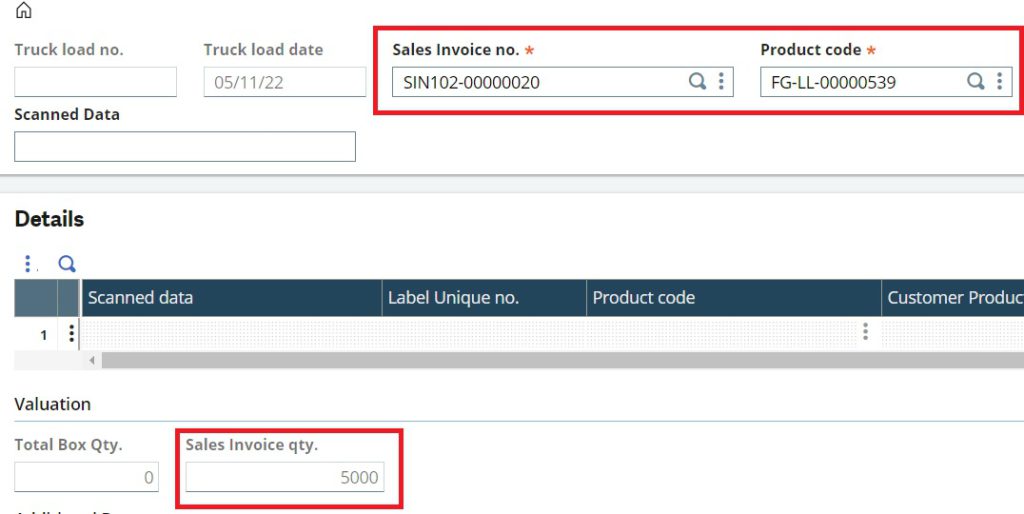
- The user will begin the process through clicking the New button on the right top side and will be asked to choose the mandatory Sales Invoice no. from the selection menu. Upon selecting Sales Invoice no. user gets to select the Products (that are only linked to the particular Invoice no.) from the mandatory Product code menu field.
- Once both the above fields are filled the screen will automatically reflect the corresponding Sales Invoice quantity of the Product on the “Sales Invoice qty.” display field under Details screen. Refer the below figures Fig. 2 & 3.
3. Now all that remains for the user is to begin the labels scanning process. However, before this process the scanning tool needs to be connected properly to the system via serial port and verify it’s working prior.
4. Here, for our requirement we’re scanning custom made QR code labels based on the manufacturing production tracking process. There can be multiple box labels having partial quantities corresponding to a particular Invoiced Product, so the screen provides the solution to track and evaluate the total label quantities.
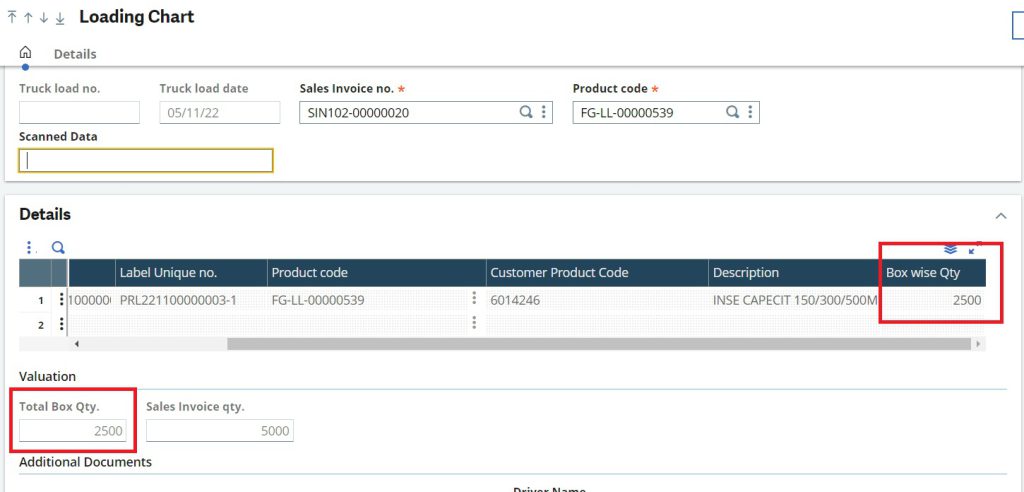
5. When a QR Code is scanned, data is flown immediately to the Scanned data field on the Header. If it passes the validations, the corresponding data in the QR Code will be flown on the Detail screen’s data grid columns and the screen becomes ready for the next scan.
6. As the data grid inserts scan records then the summation of Box quantity field displays on the Total Box Qty. field below the grid as shown in Fig. 4.
7. A Loading Chart entry creation is only possible when all the proper labels are scanned and the Total Box quantity matches Invoice quantity. This process shows how the screen main functionality works, however along with this the screen provides several optional Information fields that the user can provide such as checklist for Transaction documents to be provided, Transporter’s name and contact info.
8. Once the entry is created from the same screen the user gets to have a custom detailed report based on the entry.
Validations provided:
-This section showcases some of many validations provided in the screen during creation to minimize any manual error by the user.
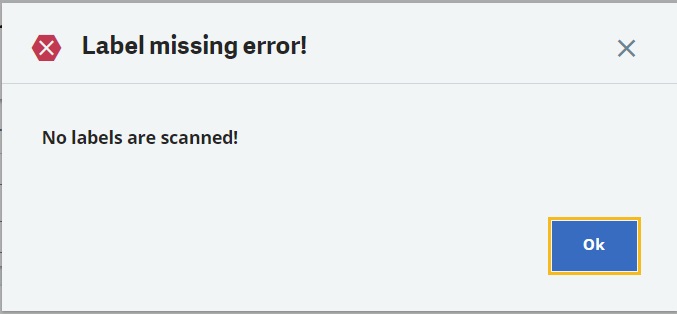
-First validation is provided to handle any creation attempt without scan or having a blank grid as shown in Fig. 5.
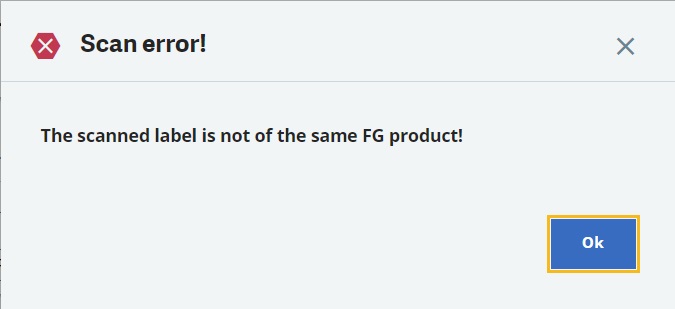
-A validation for correctly identifying whether the QR Code is referencing the selected Invoiced product as shown in Fig. 6.
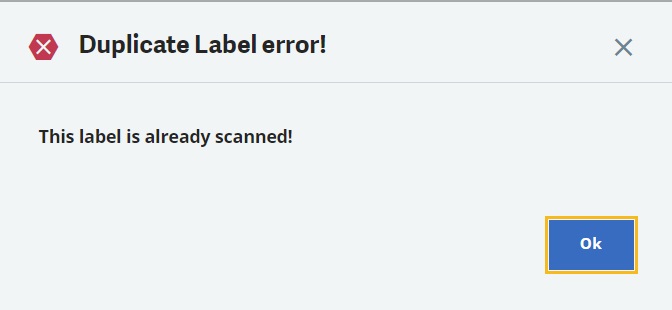
-Another validation deals with restricting and informing the user of any duplicate scanning attempt as shown in Fig. 7.
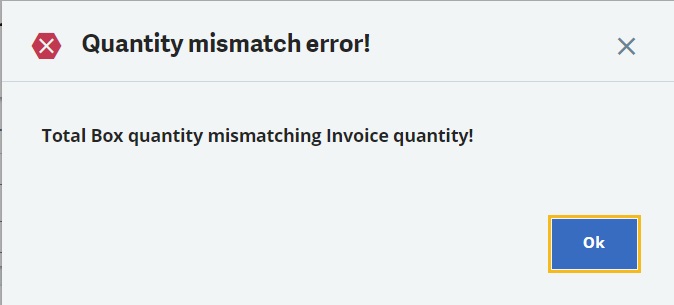
-Then we’ve our main creation validation for Quantity validation as shown in Fig. 8.
This is how our customization works within Sage X3 in providing a business solution to tackle a popular requirement in a quick and safeguard fashion.
About Us
Greytrix – a globally recognized and one of the oldest Sage Development Partners is a one-stop solution provider for Sage ERP and Sage CRM organizational needs. Being acknowledged and rewarded for multi-man years of experience and expertise, we bring complete end-to-end assistance for your technical consultations, product customizations, data migration, system integrations, third-party add-on development, and implementation competence.
Greytrix has some unique integration solutions developed for Sage CRM with Sage ERPs namely Sage X3, Sage Intacct, Sage 100, Sage 500, and Sage 300. We also offer best-in-class Sage ERP and Sage CRM customization and development services to Business Partners, End Users, and Sage PSG worldwide. Greytrix helps in the migration of Sage CRM from Salesforce | ACT! | SalesLogix | Goldmine | Sugar CRM | Maximizer. Our Sage CRM Product Suite includes addons like Greytrix Business Manager, Sage CRM Project Manager, Sage CRM Resource Planner, Sage CRM Contract Manager, Sage CRM Event Manager, Sage CRM Budget Planner, Gmail Integration, Sage CRM Mobile Service Signature, Sage CRM CTI Framework.
Greytrix is a recognized Sage Champion Partner for GUMU™ Sage X3 – Sage CRM integration listed on Sage Marketplace and Sage CRM – Sage Intacct integration listed on Sage Intacct Marketplace. The GUMU™ Cloud framework by Greytrix forms the backbone of cloud integrations that are managed in real-time for the processing and execution of application programs at the click of a button.
For more information on our integration solutions, please contact us at sage@greytrix.com. We will be glad to assist you.