Sage Enterprise Intelligence is an intuitive business intelligence solution integrated with your Sage business management system to help business users reduce time spent on analysis and reporting and make faster, better-informed decisions. It empowers all users with a simple solution to access and analyse data in a self-sufficient manner, which eliminates the need for disparate tools and specialized skills and can reduce time to decision.
Sage Enterprise Intelligence gives business users, managers, and executives the power to analyse and create business reports, dashboards, and views. In this blog, we will take a look at how we can create pie chart in Sage Enterprise Intelligence.
Follow these steps for insight into how to create pie chart in (SEI).
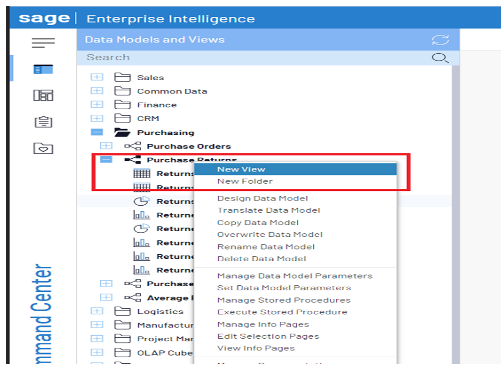
STEP1:- Right click on data models and click on new view among the different categories we can select different type of view type. The number of view types are present . As shown in figure .1 and figure .2
STEP2:-
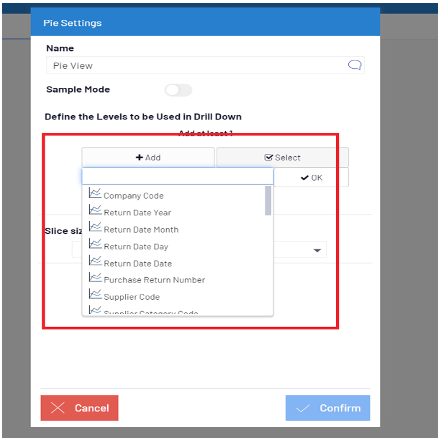
Enter a pie view name.
Choose the Columns, Groups and Pivots by clicking Add.
Type the name to filter the list (or select from the drop-down menu). Choose one or more fields.
Click OK to confirm the chosen fields. As shown in figure 3.
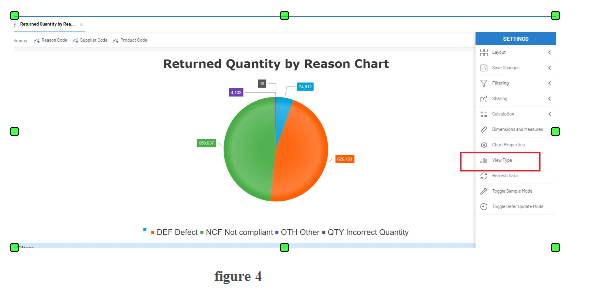
STEP3:- To change the view from a table with tabs to a graphical illustration, click on View Type in the vertical right-hand panel to expand Settings. The columns we choose in figure.3 are represented in pie chart format . As shown in figure 4.
STEP 4: This will expand the menu, showing the options for different View types you can select from. You can scroll vertically through the View categories in the Left side of the pop up, and then chose specific Views within each category. The images below show the “Bar” category and “Pie” category options to give context to the wide variety of built in options available. For our example, we’ll click on the “Pie” chart in the “Pie” category (it may be on our mind with fruit pie season in full swing).
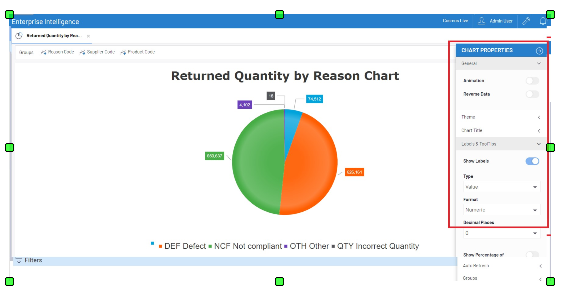
STEP 5: Once we’ve update our View Type, it will automatically close the expanded menus and update the Sales Report. Next, in the same vertical right-hand panel, click on Chart Properties (the wrench icon immediately above View Type) to specify the details for your graph.
STEP 6: In Chart Properties, you can modify the report title, labels, series, etc. The specific changes made will depend on how you want the information displayed in your dashboard. For reference, pay attention to the chart properties specified in the following screenshot. By enabling Animation (the very top toggle option), we’ve set up this graph so when you hover over a pie slice it will provide further details, which in this case is order quantity.
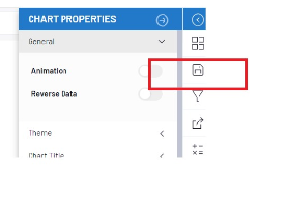
STEP 7: Once the done layout of the graph, click the floppy disc save icon on the right of the screen and click save as.
This blog help us to know about the use of create and design pie chart in SEI report.
About Us
Greytrix – a globally recognized Premier Sage Gold Development Partner is a one-stop solution provider for Sage ERP and Sage CRM needs. Being recognized and rewarded for multi-man years of experience, we bring complete end-to-end assistance for your technical consultations, product customizations, data migration, system integrations, third-party add-on development and implementation expertise.
Greytrix caters to a wide range of Sage X3 (Sage Enterprise Management) offerings – a Sage Business Cloud Solution. Our unique GUMU™ integrations include Sage X3 for Sage CRM, Salesforce.com and Magento eCommerce along with Implementation and Technical Support worldwide for Sage X3 (Sage Enterprise Management). Currently we are Sage X3 Implementation Partner in East Africa, Middles East, Australia, Asia. We also offer best-in-class Sage X3 customization and development services, integrated applications such as POS | WMS | Payment Gateway | Shipping System | Business Intelligence | eCommerce and have developed add-ons such as Catch – Weight and Letter of Credit for Sage X3 to Sage business partners, end users and Sage PSG worldwide.
Greytrix is a recognized Sage Rockstar ISV Partner for GUMU™ Sage X3 – Sage CRM integration also listed on Sage Marketplace; GUMU™ integration for Sage X3 – Salesforce is a 5-star app listed on Salesforce AppExchange.
For more information on Sage X3 Integration and Services, please contact us at x3@greytrix.com. We will be glad to assist you.