In Sage X3, the term “Dashboard” typically refers to a user interface feature that visually represents the relevant data. These dashboards are customizable and can be tailored to suit the specific needs of users or departments within an organization.
Sage X3 dashboards allow users to monitor various aspects of their business in real time, such as sales figures, inventory levels, production metrics, financial performance, and more. They often incorporate charts, graphs, tables, and other visual elements to present data clearly and concisely, enabling users to quickly assess the health of their operations and make informed decisions.
NOTE:
Please use the provided link to create a dashboard in Sage X3. The following steps outline how to filter the data you wish to display on the dashboard.
https://www.greytrix.com/blogs/sagex3/2019/08/29/how-to-add-the-dashboard-in-sage-x3-version-12/
We will investigate on how to apply filters to refine the data displayed on Sage X3 dashboards, as per your request.
To ensure the dashboard shows the necessary data, we’ll set conditions in the Query tool. Specifically, we’ll focus on displaying data that’s partially signed or in part status.
To achieve this task, follow these simplified steps outlined below:
Step 1: Create a Query tool by navigating through the following path:
- Setup -> Usage -> Reports -> Query tool.
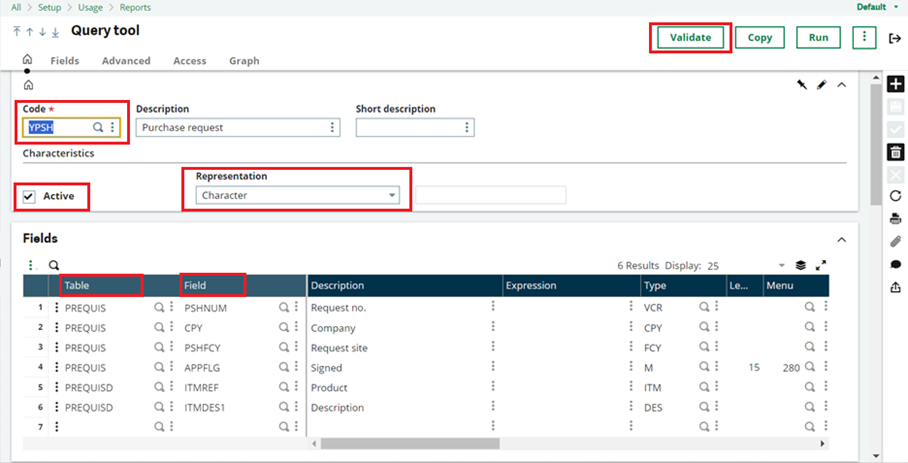
Fig 1: Query tool
To display filtered records on dashboards, follow these simplified and extended steps:
Step 2: Add conditions to filter the data as needed. You can specify criteria to refine the dataset displayed on the dashboard.
- To filter records, you simply enter the condition in the Query Tool screen. This allows you to precisely tailor the data displayed on the dashboard to meet your requirements.
- Navigate to the Advanced tab. This section provides additional options and settings for fine-tuning your data filtering process, allowing for more precise control over the displayed information.
- Locate the Selection Criteria grid and input the necessary condition you wish to showcase on the dashboards. This step allows you to specify the exact parameters for filtering the data according to your preferences, ensuring the dashboard displays the desired information accurately.
- Currently, we’ll focus on displaying Purchase requests that are in a ‘partially signed’ or ‘in part’ status. This ensures that only relevant data meeting these criteria will be showcased on the dashboard.
- To achieve this, we’ve set the condition in the selection criteria grid where the flag is designated as ‘2’. This ensures that only Purchase requests with the flag indicating ‘partial signing’ or ‘in part’ status are included in the data displayed on the dashboard.
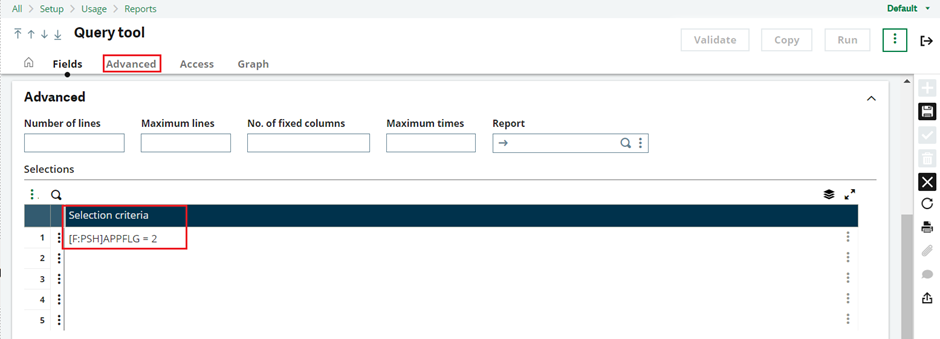
Fig 2: Selection criteria
Once you’ve added the condition to the selection criteria grid, save the flow/process, and proceed to validate it by clicking on the Validate button located on the Query tool screen. This ensures that the changes made are accurately applied and the data filtering process is functioning as intended.
Step 3: After setting the conditions in the selection criteria, to view the filtered data, log out from the system and then log back in. This will ensure that the dashboard displays the records filtered based on the specified conditions you’ve set.
- Sometimes, clicking the refresh button on dashboards may display filtered records. However, we recommend logging out and logging back in to ensure consistent and accurate filtering of data. This process guarantees that the dashboard reflects the updated records based on the specified conditions you’ve set.
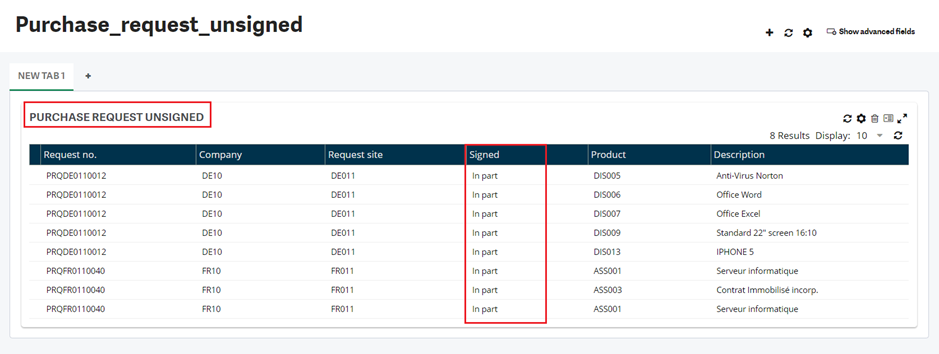
Fig 3: Dashboard with condition of partially signed.
Thus, to display filtered records on dashboards, simply input the conditions in the Selection Criteria. This method ensures that the dashboard accurately presents the filtered data according to your specified conditions, facilitating better analysis and decision-making.