Sage Enterprise Intelligence gives business users, managers and executives the power to analyze and create business reports, dashboards and views. Dashboards are a quick and effective way for decision makers to get detailed insight into business. In this blog we will have a look on how we can create a dashboards in Sage Enterprise Intelligence
In order to create dashboards in SEI, Firstly we need to design data model and by using this data model we can create a views, reports and dashboards. We can use this views or reports to create a dashboards.
Below are the steps to design dashboards:
In the command centre section, Navigate to Dashboards.
Create a new folder, here we will create a folder named as ZTEST. Refer the below figure.
Inside this folder, We will create a DASHBOARD, Click on the folder name and select new dashboard. Here we will create a dashboard named as ZTEST.
Refer the below figure.
Dashboard is basically a combination of two or multiple views or reports.
From the data models and views section, select the views that you want to include in the dashboards. Here we will include four views which will display the sales data and sales vs deliveries data. Once we have done with adding of views then click on save for saving the dashboards. Refer the below figure.
After creation if we want to do some changes on the dashboard then click on Edit dashboard from setting.
There are some properties which can be used.
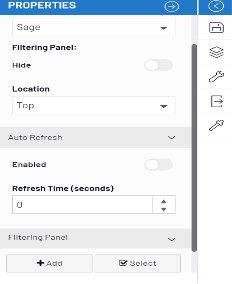
- Theme: We can provide specific theme to the dashboards such as material, material black, metro, metro black, sage etc.
- Filtering Panel: This helps us to add a filter condition according to which we want to display data in the dashboard.
- Hide: This is used to disable or enable the filtering panel used in the dashboard.
- Location: This is used to give location to the filtering panel such as Top and bottom.
- Auto Refresh: This helps us to enable the auto refresh so that data will be automatically refreshed. Also we can provide the refreshing time.
If we don’t want to do changes on entire dashboard, it is also possible to do changes on a specific view. Click on the setting icon on that view and can do any changes that we want.
Below are the properties that can be used to edit specific views.
- Column header: This refers to the title of the column
- Hide: It is possible to hide the title using hide.
- Font Color/Background color : This help us to give background or font colour to title.
- Bold/Italic/Underline: This is used to keep the title bold and italic and also we can underline the title.
- Groups/Columns/Pivot: This helps us to add more groups or columns as well we can add column to pivot
This blog helps us to know how dashboards can be created in Sage Enterprise Intelligence.
About Us
Greytrix – a globally recognized and one of the oldest Sage Development Partners is a one-stop solution provider for Sage ERP and Sage CRM organizational needs. Being acknowledged and rewarded for multi-man years of experience and expertise, we bring complete end-to-end assistance for your technical consultations, product customizations, data migration, system integrations, third-party add-on development, and implementation competence.
Greytrix has some unique integration solutions developed for Sage CRM with Sage ERPs namely Sage X3, Sage Intacct, Sage 100, Sage 500, and Sage 300. We also offer best-in-class Sage ERP and Sage CRM customization and development services to Business Partners, End Users, and Sage PSG worldwide. Greytrix helps in the migration of Sage CRM from Salesforce | ACT! | SalesLogix | Goldmine | Sugar CRM | Maximizer. Our Sage CRM Product Suite includes addons like Greytrix Business Manager, Sage CRM Project Manager, Sage CRM Resource Planner, Sage CRM Contract Manager, Sage CRM Event Manager, Sage CRM Budget Planner, Gmail Integration, Sage CRM Mobile Service Signature, Sage CRM CTI Framework.
Greytrix is a recognized Sage Champion Partner for GUMU™ Sage X3 – Sage CRM integration listed on Sage Marketplace and Sage CRM – Sage Intacct integration listed on Sage Intacct Marketplace. The GUMU™ Cloud framework by Greytrix forms the backbone of cloud integrations that are managed in real-time for the processing and execution of application programs at the click of a button.
For more information on our integration solutions, please contact us at sage@greytrix.com. We will be glad to assist you.