In industries, Dashboard plays a very important role for users which provides summarized data of organizations, transactions, and masters. Likewise, we received a requirement to create a dashboard that provides sales amounts by product category. For that requirement, we were requested to display the top 10 greater amounts of sales by category, and then at the last line, the category-wise sum of sales value for the remaining category will be displayed.
To achieve the above requirement we have created a Sage X3 view with the required SQL query and then we have added the same view into the graphical query tool as shown below screenshot.
New stuff: Dispatch Dashboard and Report
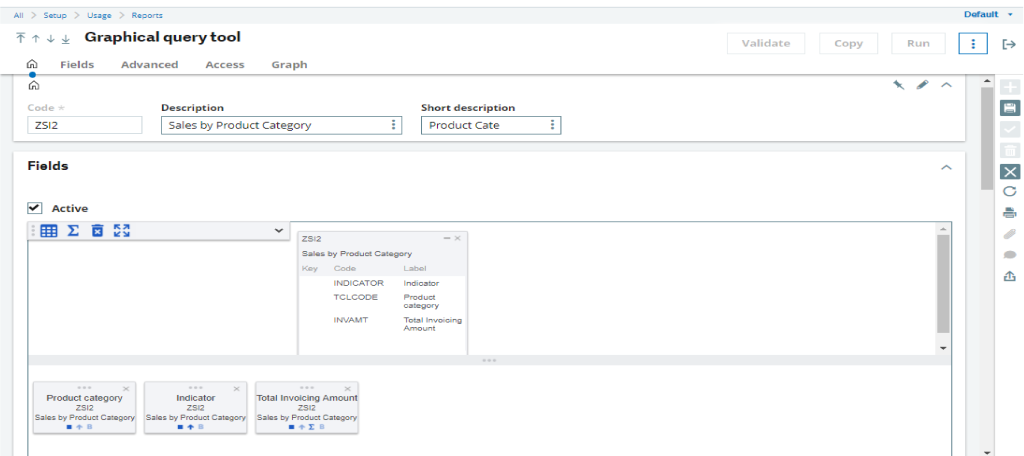
Here our view is working as a table that contains only three fields i.e. indicator, Product category, and the amount which we have to display on the dashboard.
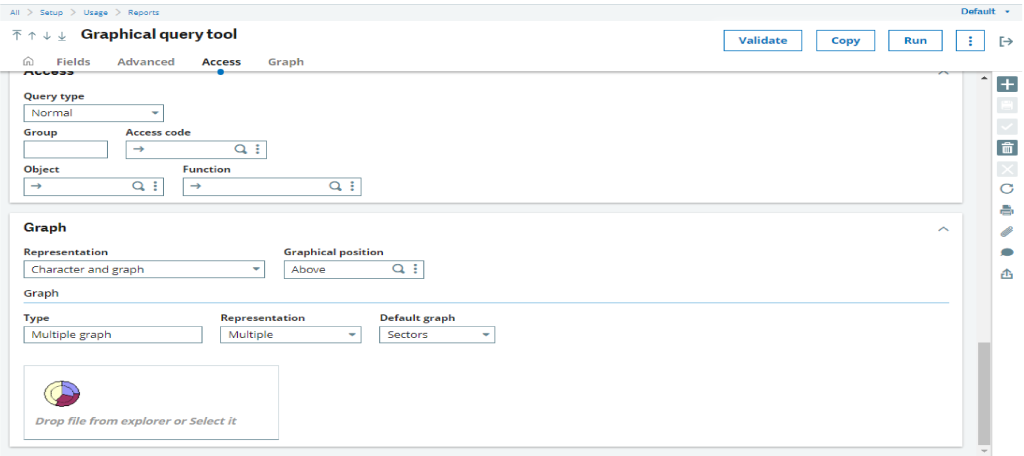
Once we have added view and the required columns to our graphical query tool then we need to select representation as character and graph and required options at the graph tab of the graphical query tool as shown below screenshot.
Once we are done with our query tool then we have to add same query tool to the dashboard landing page, for the same you can refer below blog in which we have mentioned how to create the dashboard.
How to add the Dashboard in Sage X3 Version 12
Once we are done with the dashboard landing page, then we can see the output as shown in the below screenshot.
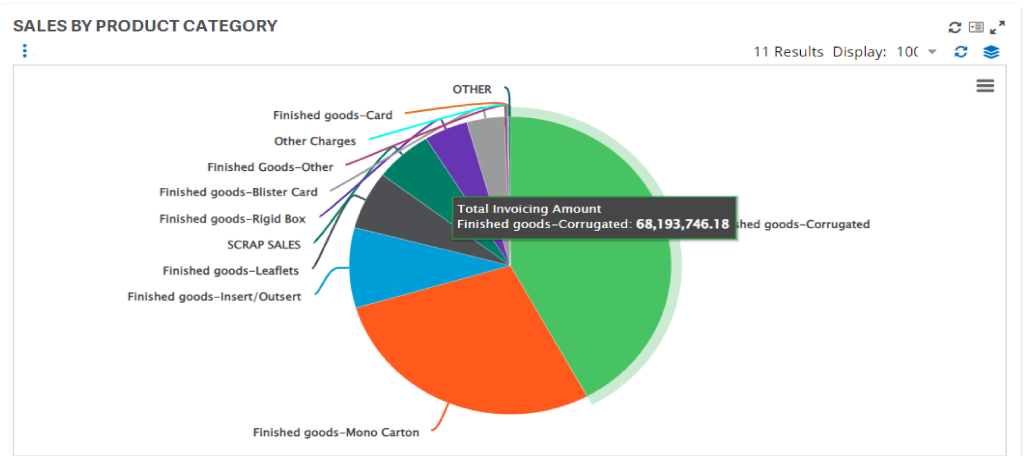
In this way, we can create a dashboard for customer sales by product category in Sage X3.
About Us
Greytrix – a globally recognized and one of the oldest Sage Development Partners is a one-stop solution provider for Sage ERP and Sage CRM organizational needs. Being acknowledged and rewarded for multi-man years of experience and expertise, we bring complete end-to-end assistance for your technical consultations, product customizations, data migration, system integrations, third-party add-on development, and implementation competence.
Greytrix has some unique integration solutions developed for Sage CRM with Sage ERPs namely Sage X3, Sage Intacct, Sage 100, Sage 500, and Sage 300. We also offer best-in-class Sage ERP and Sage CRM customization and development services to Business Partners, End Users, and Sage PSG worldwide. Greytrix helps in the migration of Sage CRM from Salesforce | ACT! | SalesLogix | Goldmine | Sugar CRM | Maximizer. Our Sage CRM Product Suite includes addons like Greytrix Business Manager, Sage CRM Project Manager, Sage CRM Resource Planner, Sage CRM Contract Manager, Sage CRM Event Manager, Sage CRM Budget Planner, Gmail Integration, Sage CRM Mobile Service Signature, Sage CRM CTI Framework.
Greytrix is a recognized Sage Champion Partner for GUMU™ Sage X3 – Sage CRM integration listed on Sage Marketplace and Sage CRM – Sage Intacct integration listed on Sage Intacct Marketplace. The GUMU™ Cloud framework by Greytrix forms the backbone of cloud integrations that are managed in real-time for the processing and execution of application programs at the click of a button.
For more information on our integration solutions, please contact us at sage@greytrix.com. We will be glad to assist you.